|
Download Data (XLS File) |
|
||||||||
|
||||||||
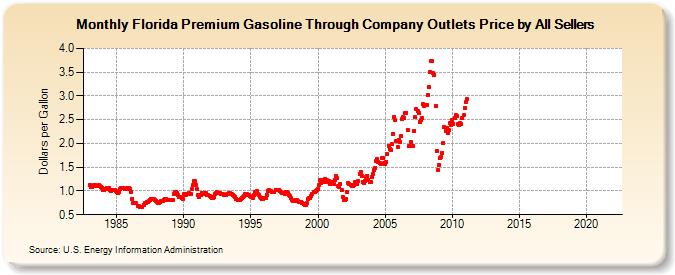
| Florida Premium Gasoline Through Company Outlets Price by All Sellers (Dollars per Gallon) | ||||||||
| Year | Jan | Feb | Mar | Apr | May | Jun | Jul | Aug | Sep | Oct | Nov | Dec |
|---|---|---|---|---|---|---|---|---|---|---|---|---|
| 1983 | 1.125 | 1.090 | 1.075 | 1.099 | 1.123 | 1.126 | 1.113 | 1.108 | 1.117 | 1.110 | 1.092 | 1.072 |
| 1984 | 1.014 | 1.026 | 1.045 | 1.059 | 1.064 | 1.056 | 1.029 | 1.009 | 1.016 | 1.017 | 1.015 | 1.005 |
| 1985 | 0.971 | 0.955 | 0.983 | 1.038 | 1.056 | 1.056 | 1.056 | 1.043 | 1.037 | 1.061 | 1.062 | 1.059 |
| 1986 | 1.042 | 0.985 | 0.841 | 0.748 | 0.743 | 0.753 | NA | 0.691 | 0.692 | 0.662 | 0.652 | 0.665 |
| 1987 | 0.710 | 0.742 | 0.744 | 0.767 | 0.775 | 0.793 | 0.820 | 0.837 | 0.839 | 0.826 | 0.811 | 0.795 |
| 1988 | 0.770 | 0.751 | 0.751 | 0.773 | 0.796 | 0.796 | 0.817 | 0.829 | 0.834 | 0.819 | 0.817 | 0.804 |
| 1989 | 0.806 | 0.808 | 0.816 | 0.926 | 0.979 | 0.976 | 0.959 | 0.909 | 0.871 | 0.866 | 0.844 | 0.840 |
| 1990 | 0.931 | 0.927 | 0.914 | 0.929 | 0.937 | 0.950 | 0.940 | 1.038 | 1.119 | 1.210 | 1.212 | 1.130 |
| 1991 | 1.032 | 0.925 | 0.883 | 0.922 | 0.957 | 0.951 | 0.933 | 0.947 | 0.953 | 0.913 | 0.911 | 0.898 |
| 1992 | 0.877 | 0.860 | 0.855 | 0.874 | 0.926 | 0.966 | 0.969 | 0.956 | 0.949 | 0.945 | 0.946 | 0.934 |
| 1993 | 0.915 | 0.910 | 0.909 | 0.931 | 0.947 | 0.957 | 0.943 | 0.928 | 0.912 | 0.901 | 0.879 | 0.832 |
| 1994 | 0.801 | 0.813 | 0.820 | 0.836 | 0.850 | 0.867 | 0.897 | 0.939 | 0.938 | 0.923 | 0.913 | 0.892 |
| 1995 | 0.876 | 0.866 | 0.860 | 0.907 | 0.987 | 0.993 | 0.946 | 0.913 | 0.883 | 0.858 | 0.830 | 0.831 |
| 1996 | 0.850 | 0.862 | 0.915 | 0.998 | 1.029 | 1.006 | 0.989 | 0.968 | 0.973 | 0.987 | 1.019 | 1.030 |
| 1997 | 1.029 | 1.017 | 0.989 | 0.974 | 0.960 | 0.949 | 0.930 | 0.971 | 0.968 | 0.956 | 0.921 | 0.886 |
| 1998 | 0.845 | 0.808 | 0.784 | 0.792 | 0.804 | 0.809 | 0.794 | 0.772 | 0.758 | 0.772 | 0.756 | 0.717 |
| 1999 | 0.712 | 0.695 | 0.737 | 0.836 | 0.852 | 0.843 | 0.890 | 0.946 | 0.973 | 0.988 | 0.999 | 1.025 |
| 2000 | 1.037 | 1.122 | 1.226 | 1.165 | 1.182 | 1.233 | 1.247 | 1.182 | 1.229 | 1.218 | 1.200 | 1.146 |
| 2001 | 1.186 | 1.197 | 1.146 | 1.240 | 1.312 | 1.267 | 1.105 | 1.082 | 1.137 | 1.012 | 0.881 | 0.801 |
| 2002 | 0.813 | 0.824 | 0.976 | 1.163 | 1.150 | 1.121 | 1.114 | 1.114 | 1.121 | 1.190 | 1.176 | 1.139 |
| 2003 | 1.205 | 1.351 | 1.399 | 1.311 | 1.182 | 1.164 | 1.202 | 1.301 | 1.323 | 1.229 | 1.188 | 1.179 |
| 2004 | 1.303 | 1.363 | 1.441 | 1.492 | 1.635 | 1.672 | 1.616 | 1.579 | 1.563 | 1.690 | 1.700 | 1.582 |
| 2005 | 1.561 | 1.610 | 1.769 | 1.955 | 1.880 | 1.870 | 1.978 | 2.209 | 2.562 | 2.487 | 2.058 | 1.926 |
| 2006 | 2.073 | 2.025 | 2.154 | 2.518 | 2.552 | 2.535 | 2.644 | 2.647 | 2.274 | 1.941 | 1.946 | 2.030 |
| 2007 | 1.936 | 1.955 | 2.264 | 2.558 | 2.731 | 2.680 | 2.632 | 2.458 | 2.483 | 2.531 | 2.821 | 2.779 |
| 2008 | 2.802 | 2.801 | 3.015 | 3.183 | 3.501 | 3.727 | 3.736 | 3.473 | 3.444 | 2.793 | 1.838 | 1.437 |
| 2009 | 1.550 | 1.687 | 1.717 | 1.806 | 2.014 | 2.354 | 2.261 | 2.315 | 2.214 | 2.277 | 2.425 | 2.392 |
| 2010 | 2.488 | 2.413 | 2.538 | 2.592 | 2.572 | 2.417 | 2.394 | 2.424 | 2.406 | 2.527 | 2.593 | 2.748 |
| 2011 | 2.867 | 2.931 | - | - | - | - | - | - | - | - | - | - |
| 2012 | - | - | - | - | - | - | - | - | - | - | - | - |
| 2013 | - | - | - | - | - | - | - | - | - | - | - | - |
| 2014 | - | - | - | - | - | - | - | - | - | - | - | - |
| 2015 | - | - | - | - | - | - | - | - | - | - | - | - |
| 2016 | - | - | - | - | - | - | - | - | - | - | - | - |
| 2017 | - | - | - | - | - | - | - | - | - | - | - | - |
| 2018 | - | - | - | - | - | - | - | - | - | - | - | - |
| 2019 | - | - | - | - | - | - | - | - | - | - | - | - |
| 2020 | - | - | - | - | - | - | - | - | - | - | - | - |
| 2021 | - | - | - | - | - | - | - | - | - | - | - | - |
| 2022 | - | - | - | |||||||||
| - = No Data Reported; -- = Not Applicable; NA = Not Available; W = Withheld to avoid disclosure of individual company data. |
| Release Date: 6/1/2022 |
| Next Release Date: TBD |