|
Download Data (XLS File) |
|
||||||||
|
||||||||
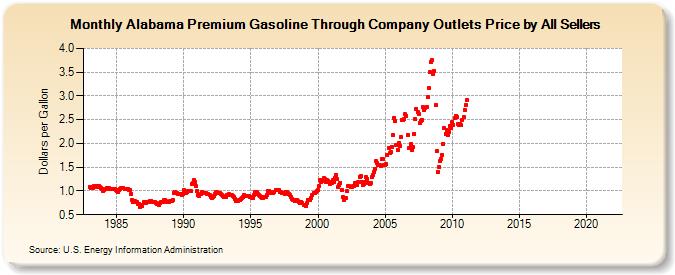
| Alabama Premium Gasoline Through Company Outlets Price by All Sellers (Dollars per Gallon) | ||||||||
| Year | Jan | Feb | Mar | Apr | May | Jun | Jul | Aug | Sep | Oct | Nov | Dec |
|---|---|---|---|---|---|---|---|---|---|---|---|---|
| 1983 | 1.090 | 1.062 | 1.078 | 1.072 | 1.099 | 1.107 | 1.087 | 1.099 | 1.098 | 1.081 | 1.057 | 1.047 |
| 1984 | 1.005 | 1.021 | 1.036 | 1.061 | 1.067 | 1.057 | 1.048 | 1.049 | 1.047 | 1.042 | 1.044 | 1.018 |
| 1985 | 0.992 | 0.968 | 1.017 | 1.050 | 1.065 | 1.065 | 1.060 | 1.047 | 1.043 | 1.044 | 1.050 | 1.026 |
| 1986 | 1.025 | 0.943 | 0.815 | 0.770 | 0.787 | 0.772 | 0.766 | 0.728 | 0.733 | 0.670 | 0.699 | 0.680 |
| 1987 | 0.762 | 0.746 | 0.757 | 0.771 | 0.763 | 0.774 | 0.779 | 0.794 | 0.775 | 0.773 | 0.770 | 0.750 |
| 1988 | 0.725 | 0.721 | 0.712 | 0.757 | 0.774 | 0.774 | 0.803 | 0.807 | 0.782 | 0.773 | 0.760 | 0.764 |
| 1989 | 0.795 | 0.792 | 0.820 | 0.962 | 0.974 | 0.958 | 0.949 | 0.929 | 0.945 | 0.929 | 0.915 | 0.936 |
| 1990 | 1.010 | 0.973 | 0.966 | 0.973 | 0.995 | 1.000 | 0.993 | 1.143 | 1.167 | 1.220 | 1.192 | 1.094 |
| 1991 | 0.991 | 0.925 | 0.904 | 0.937 | 0.975 | 0.967 | 0.951 | 0.953 | 0.961 | 0.940 | 0.935 | 0.915 |
| 1992 | 0.880 | 0.857 | 0.863 | 0.898 | 0.939 | 0.968 | 0.970 | 0.955 | 0.951 | 0.940 | 0.923 | 0.897 |
| 1993 | 0.877 | 0.869 | 0.874 | 0.918 | 0.933 | 0.924 | 0.908 | 0.908 | 0.891 | 0.877 | 0.832 | 0.790 |
| 1994 | 0.783 | 0.801 | 0.806 | 0.827 | 0.845 | 0.872 | 0.906 | 0.898 | 0.899 | 0.894 | 0.893 | 0.874 |
| 1995 | 0.864 | 0.856 | 0.859 | 0.917 | 0.979 | 0.973 | 0.929 | 0.909 | 0.897 | 0.874 | 0.847 | 0.852 |
| 1996 | 0.870 | 0.874 | 0.917 | 1.000 | 1.006 | 0.983 | 0.959 | 0.952 | 0.955 | 0.979 | 1.013 | 1.010 |
| 1997 | 1.015 | 1.018 | 0.983 | 0.974 | 0.966 | 0.955 | 0.945 | 0.981 | 0.981 | 0.955 | 0.938 | 0.909 |
| 1998 | 0.869 | 0.833 | 0.807 | 0.794 | 0.801 | 0.809 | 0.788 | 0.761 | 0.741 | 0.768 | 0.746 | 0.709 |
| 1999 | 0.695 | 0.686 | 0.738 | 0.815 | 0.810 | 0.804 | 0.851 | 0.915 | 0.959 | 0.957 | 0.968 | 0.999 |
| 2000 | 1.020 | 1.099 | 1.231 | 1.187 | 1.199 | 1.265 | 1.247 | 1.183 | 1.221 | 1.214 | 1.196 | 1.148 |
| 2001 | 1.171 | 1.220 | 1.178 | 1.277 | 1.337 | 1.255 | 1.081 | 1.118 | 1.177 | 1.022 | 0.865 | 0.809 |
| 2002 | 0.845 | 0.857 | 0.990 | 1.112 | 1.098 | 1.075 | 1.082 | 1.102 | 1.112 | 1.168 | 1.123 | 1.117 |
| 2003 | 1.191 | 1.303 | 1.305 | 1.196 | 1.118 | 1.137 | 1.195 | 1.290 | 1.262 | 1.176 | 1.149 | 1.157 |
| 2004 | 1.288 | 1.337 | 1.395 | 1.470 | 1.621 | 1.587 | 1.547 | 1.542 | 1.529 | 1.672 | 1.662 | 1.538 |
| 2005 | 1.540 | 1.564 | 1.754 | 1.904 | 1.790 | 1.826 | 1.932 | 2.173 | 2.541 | 2.469 | 1.973 | 1.862 |
| 2006 | 2.012 | 1.948 | 2.134 | 2.495 | 2.491 | 2.510 | 2.614 | 2.587 | 2.183 | 1.897 | 1.907 | 1.982 |
| 2007 | 1.872 | 1.916 | 2.204 | 2.511 | 2.733 | 2.661 | 2.612 | 2.434 | 2.473 | 2.500 | 2.770 | 2.698 |
| 2008 | 2.742 | 2.760 | 2.975 | 3.164 | 3.498 | 3.722 | 3.749 | 3.462 | 3.527 | 2.804 | 1.834 | 1.405 |
| 2009 | 1.503 | 1.631 | 1.680 | 1.766 | 1.994 | 2.315 | 2.201 | 2.285 | 2.175 | 2.233 | 2.365 | 2.333 |
| 2010 | 2.449 | 2.394 | 2.531 | 2.586 | 2.555 | 2.416 | 2.392 | 2.406 | 2.386 | 2.496 | 2.555 | 2.704 |
| 2011 | 2.812 | 2.916 | - | - | - | - | - | - | - | - | - | - |
| 2012 | - | - | - | - | - | - | - | - | - | - | - | - |
| 2013 | - | - | - | - | - | - | - | - | - | - | - | - |
| 2014 | - | - | - | - | - | - | - | - | - | - | - | - |
| 2015 | - | - | - | - | - | - | - | - | - | - | - | - |
| 2016 | - | - | - | - | - | - | - | - | - | - | - | - |
| 2017 | - | - | - | - | - | - | - | - | - | - | - | - |
| 2018 | - | - | - | - | - | - | - | - | - | - | - | - |
| 2019 | - | - | - | - | - | - | - | - | - | - | - | - |
| 2020 | - | - | - | - | - | - | - | - | - | - | - | - |
| 2021 | - | - | - | - | - | - | - | - | - | - | - | - |
| 2022 | - | - | - | |||||||||
| - = No Data Reported; -- = Not Applicable; NA = Not Available; W = Withheld to avoid disclosure of individual company data. |
| Release Date: 6/1/2022 |
| Next Release Date: TBD |