|
Download Data (XLS File) |
|
||||||||
|
||||||||
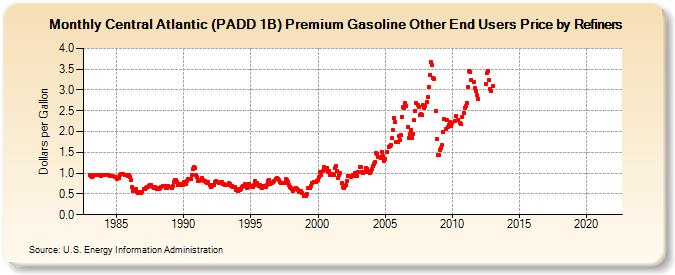
| Central Atlantic (PADD 1B) Premium Gasoline Other End Users Price by Refiners (Dollars per Gallon) | ||||||||
| Year | Jan | Feb | Mar | Apr | May | Jun | Jul | Aug | Sep | Oct | Nov | Dec |
|---|---|---|---|---|---|---|---|---|---|---|---|---|
| 1983 | 0.965 | 0.934 | 0.904 | 0.924 | 0.952 | 0.953 | 0.962 | 0.963 | 0.957 | 0.944 | 0.941 | 0.960 |
| 1984 | 0.954 | 0.958 | 0.957 | 0.959 | 0.957 | 0.947 | 0.925 | 0.922 | 0.934 | 0.932 | 0.906 | 0.898 |
| 1985 | 0.868 | 0.890 | 0.887 | 0.954 | 0.970 | 0.972 | 0.972 | 0.961 | 0.964 | 0.962 | 0.943 | 0.947 |
| 1986 | 0.912 | 0.840 | 0.674 | 0.573 | 0.619 | 0.626 | 0.544 | 0.516 | 0.537 | 0.527 | 0.534 | 0.544 |
| 1987 | 0.617 | 0.613 | 0.648 | 0.657 | 0.678 | 0.685 | 0.712 | 0.719 | 0.674 | 0.653 | 0.660 | 0.646 |
| 1988 | 0.622 | 0.647 | 0.627 | 0.653 | 0.678 | 0.691 | 0.699 | 0.684 | 0.649 | 0.653 | 0.694 | 0.674 |
| 1989 | 0.667 | 0.651 | 0.685 | 0.797 | 0.839 | 0.826 | 0.777 | 0.710 | 0.739 | 0.740 | 0.710 | 0.704 |
| 1990 | 0.796 | 0.770 | 0.739 | 0.817 | 0.852 | 0.848 | 0.868 | 0.961 | 1.089 | 1.136 | 1.121 | 0.966 |
| 1991 | 0.902 | 0.821 | 0.801 | 0.836 | 0.882 | 0.841 | 0.817 | 0.818 | 0.793 | 0.772 | 0.786 | 0.721 |
| 1992 | 0.674 | 0.699 | 0.704 | 0.723 | 0.780 | 0.814 | 0.777 | 0.769 | 0.785 | 0.774 | 0.794 | 0.746 |
| 1993 | 0.735 | 0.708 | 0.704 | 0.724 | 0.752 | 0.728 | 0.696 | 0.688 | 0.666 | 0.665 | 0.655 | 0.585 |
| 1994 | 0.575 | 0.607 | 0.594 | 0.615 | 0.657 | 0.689 | 0.699 | 0.727 | 0.652 | 0.672 | 0.744 | 0.679 |
| 1995 | 0.687 | 0.683 | 0.671 | 0.709 | 0.799 | 0.773 | 0.706 | 0.682 | 0.707 | 0.657 | 0.632 | 0.690 |
| 1996 | 0.698 | 0.674 | 0.720 | 0.800 | 0.833 | 0.747 | 0.767 | 0.766 | 0.787 | 0.804 | 0.850 | 0.871 |
| 1997 | 0.862 | 0.824 | 0.783 | 0.755 | 0.774 | 0.761 | 0.757 | 0.847 | 0.827 | 0.785 | 0.715 | 0.677 |
| 1998 | 0.637 | 0.612 | 0.575 | 0.614 | 0.638 | 0.617 | 0.600 | 0.549 | 0.547 | 0.572 | 0.529 | 0.458 |
| 1999 | 0.470 | 0.457 | 0.505 | 0.635 | 0.647 | 0.638 | 0.700 | 0.769 | 0.796 | 0.786 | 0.792 | 0.822 |
| 2000 | 0.833 | 0.901 | 1.026 | 0.952 | 1.048 | 1.150 | 1.126 | 1.077 | 1.131 | 1.020 | 1.040 | 0.951 |
| 2001 | 0.954 | 0.984 | 0.947 | 1.128 | 1.178 | 1.050 | 0.884 | 0.956 | 0.992 | 0.773 | 0.671 | 0.642 |
| 2002 | 0.699 | 0.707 | 0.811 | 0.940 | 0.932 | 0.908 | 0.934 | 0.945 | 0.944 | 0.993 | 0.942 | 0.931 |
| 2003 | 1.027 | 1.147 | 1.140 | 1.030 | 1.000 | 1.018 | 1.025 | 1.122 | 1.107 | 1.035 | 1.003 | 1.061 |
| 2004 | 1.098 | 1.180 | 1.229 | 1.258 | 1.481 | 1.455 | 1.400 | 1.398 | 1.358 | 1.498 | 1.414 | 1.290 |
| 2005 | 1.342 | NA | 1.514 | 1.640 | 1.647 | 1.684 | 1.836 | 2.032 | 2.336 | 2.231 | 1.749 | 1.755 |
| 2006 | 1.901 | 1.792 | 1.921 | 2.344 | 2.584 | 2.565 | 2.693 | 2.622 | 2.109 | 1.846 | 1.938 | 2.031 |
| 2007 | 1.841 | 1.949 | 2.274 | 2.498 | 2.688 | 2.636 | 2.599 | 2.395 | 2.412 | 2.397 | 2.630 | 2.575 |
| 2008 | 2.625 | 2.699 | 2.829 | 3.065 | 3.367 | 3.676 | 3.612 | 3.299 | 3.269 | 2.497 | 1.822 | 1.426 |
| 2009 | 1.433 | 1.567 | 1.613 | 1.666 | 1.999 | 2.301 | 2.060 | 2.267 | 2.103 | 2.160 | 2.228 | 2.138 |
| 2010 | 2.199 | W | 2.255 | 2.363 | W | 2.273 | W | 2.207 | 2.182 | 2.360 | 2.456 | 2.566 |
| 2011 | 2.611 | 2.691 | 3.069 | 3.458 | 3.438 | 3.250 | W | 3.193 | 3.039 | 2.970 | 2.873 | 2.777 |
| 2012 | W | W | W | W | W | W | 3.152 | 3.398 | 3.450 | 3.232 | 3.013 | 2.986 |
| 2013 | 3.090 | W | W | W | W | W | W | W | W | W | NA | W |
| 2014 | W | W | W | W | W | W | W | W | W | W | W | W |
| 2015 | W | W | W | W | W | W | W | W | W | W | W | W |
| 2016 | W | W | W | W | W | W | W | W | W | W | W | W |
| 2017 | W | W | W | - | - | - | - | - | - | - | - | - |
| 2018 | - | - | - | - | W | - | - | - | - | - | - | - |
| 2019 | - | - | - | - | - | - | - | - | - | - | - | - |
| 2020 | - | - | - | - | - | - | - | - | - | - | - | - |
| 2021 | - | - | - | - | - | - | - | - | - | - | - | - |
| 2022 | - | - | - | |||||||||
| - = No Data Reported; -- = Not Applicable; NA = Not Available; W = Withheld to avoid disclosure of individual company data. |
| Release Date: 6/1/2022 |
| Next Release Date: TBD |