|
Download Data (XLS File) |
|
||||||||
|
||||||||
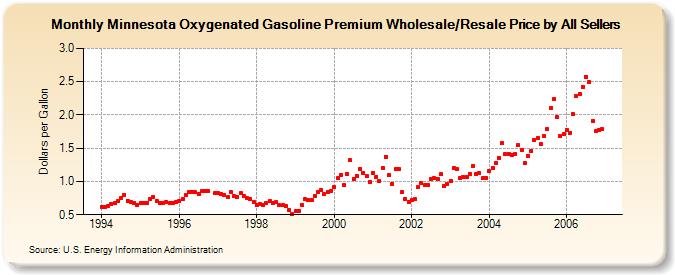
| Minnesota Oxygenated Gasoline Premium Wholesale/Resale Price by All Sellers (Dollars per Gallon) | ||||||||
| Year | Jan | Feb | Mar | Apr | May | Jun | Jul | Aug | Sep | Oct | Nov | Dec |
|---|---|---|---|---|---|---|---|---|---|---|---|---|
| 1994 | 0.616 | 0.611 | 0.632 | 0.660 | 0.672 | 0.705 | 0.752 | 0.802 | 0.713 | 0.685 | 0.678 | 0.651 |
| 1995 | 0.675 | 0.669 | 0.680 | 0.735 | 0.768 | 0.711 | 0.671 | 0.677 | 0.694 | 0.673 | 0.675 | 0.691 |
| 1996 | 0.710 | 0.730 | 0.797 | 0.847 | 0.841 | 0.837 | 0.817 | 0.849 | 0.857 | 0.857 | NA | 0.819 |
| 1997 | 0.821 | 0.810 | 0.797 | 0.764 | 0.836 | 0.776 | 0.766 | 0.819 | 0.781 | 0.753 | 0.734 | 0.692 |
| 1998 | 0.648 | 0.656 | 0.647 | 0.669 | 0.700 | 0.681 | 0.685 | 0.640 | 0.641 | 0.633 | 0.566 | 0.507 |
| 1999 | 0.552 | 0.556 | 0.651 | 0.731 | 0.720 | 0.717 | 0.782 | 0.840 | 0.868 | 0.813 | 0.844 | 0.859 |
| 2000 | 0.915 | 1.046 | 1.095 | 0.944 | 1.114 | 1.318 | 1.036 | 1.089 | 1.194 | 1.131 | 1.084 | 0.991 |
| 2001 | 1.133 | 1.073 | 1.006 | 1.207 | 1.375 | 1.095 | 0.969 | 1.185 | 1.190 | 0.837 | 0.738 | 0.689 |
| 2002 | 0.718 | 0.730 | 0.923 | 0.971 | 0.945 | 0.949 | 1.036 | 1.049 | 1.037 | 1.105 | 0.937 | 0.958 |
| 2003 | 1.013 | 1.202 | 1.182 | 1.054 | 1.064 | 1.069 | 1.115 | 1.237 | 1.110 | 1.122 | 1.046 | 1.059 |
| 2004 | 1.154 | 1.209 | 1.279 | 1.354 | 1.577 | 1.410 | 1.420 | 1.392 | 1.412 | 1.545 | 1.475 | 1.278 |
| 2005 | 1.389 | 1.459 | 1.623 | 1.653 | 1.557 | 1.682 | 1.785 | 2.100 | 2.240 | 1.962 | 1.680 | 1.706 |
| 2006 | 1.770 | 1.733 | 2.007 | 2.283 | 2.318 | 2.424 | 2.574 | 2.498 | 1.913 | 1.760 | 1.768 | 1.781 |
| - = No Data Reported; -- = Not Applicable; NA = Not Available; W = Withheld to avoid disclosure of individual company data. |
| Release Date: 6/1/2022 |
| Next Release Date: TBD |