|
Download Data (XLS File) |
|
||||||||
|
||||||||
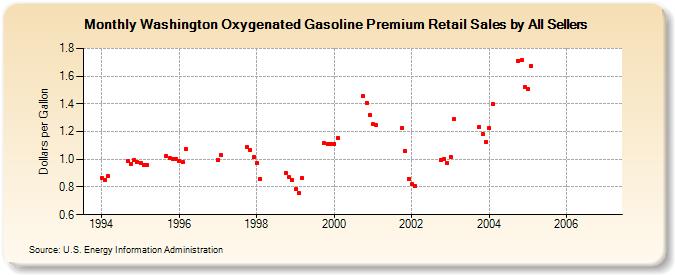
| Washington Oxygenated Gasoline Premium Retail Sales by All Sellers (Dollars per Gallon) | ||||||||
| Year | Jan | Feb | Mar | Apr | May | Jun | Jul | Aug | Sep | Oct | Nov | Dec |
|---|---|---|---|---|---|---|---|---|---|---|---|---|
| 1994 | 0.867 | 0.849 | 0.876 | W | W | W | NA | W | 0.985 | 0.967 | 0.995 | 0.977 |
| 1995 | 0.974 | 0.956 | 0.962 | W | W | W | W | W | 1.025 | 1.006 | 1.005 | 1.001 |
| 1996 | 0.991 | 0.978 | 1.073 | W | W | NA | NA | NA | NA | NA | NA | NA |
| 1997 | 0.996 | 1.028 | W | W | W | W | W | W | W | 1.087 | 1.067 | 1.017 |
| 1998 | 0.972 | 0.860 | W | W | W | W | W | W | W | 0.901 | 0.869 | 0.851 |
| 1999 | 0.785 | 0.754 | 0.867 | W | W | W | W | W | W | 1.115 | 1.110 | 1.112 |
| 2000 | 1.112 | 1.153 | W | W | W | W | W | W | W | 1.454 | 1.409 | 1.321 |
| 2001 | 1.251 | 1.246 | W | W | W | W | W | W | W | 1.228 | 1.059 | 0.858 |
| 2002 | 0.819 | 0.806 | W | W | W | W | W | W | W | 0.994 | 1.002 | 0.970 |
| 2003 | 1.020 | 1.290 | W | W | W | NA | W | W | W | 1.233 | 1.180 | 1.128 |
| 2004 | 1.225 | 1.397 | W | W | W | W | W | W | NA | 1.711 | 1.713 | 1.523 |
| 2005 | 1.504 | 1.675 | - | - | - | - | - | - | - | - | - | - |
| 2006 | - | - | - | - | - | - | - | - | - | - | - | - |
| - = No Data Reported; -- = Not Applicable; NA = Not Available; W = Withheld to avoid disclosure of individual company data. |
| Release Date: 6/1/2022 |
| Next Release Date: TBD |