|
Download Data (XLS File) |
|
||||||||
|
||||||||
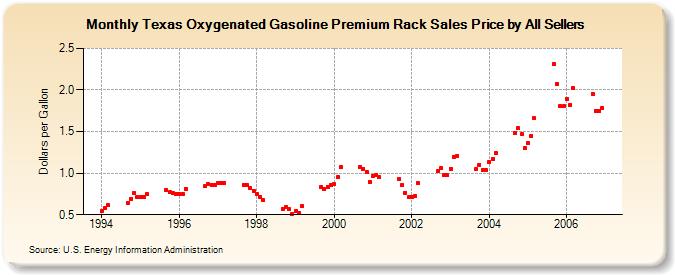
| Texas Oxygenated Gasoline Premium Rack Sales Price by All Sellers (Dollars per Gallon) | ||||||||
| Year | Jan | Feb | Mar | Apr | May | Jun | Jul | Aug | Sep | Oct | Nov | Dec |
|---|---|---|---|---|---|---|---|---|---|---|---|---|
| 1994 | 0.542 | 0.585 | 0.612 | W | W | W | W | W | 0.638 | 0.689 | 0.762 | 0.710 |
| 1995 | 0.712 | 0.719 | 0.749 | W | - | - | - | W | 0.796 | 0.768 | 0.756 | 0.751 |
| 1996 | 0.748 | 0.754 | 0.812 | - | - | - | - | - | 0.841 | 0.868 | 0.859 | 0.859 |
| 1997 | 0.880 | 0.881 | 0.880 | NA | - | - | - | - | 0.862 | 0.858 | 0.819 | 0.791 |
| 1998 | 0.751 | 0.711 | 0.674 | - | - | - | - | - | 0.573 | 0.590 | 0.563 | 0.510 |
| 1999 | 0.539 | 0.526 | 0.603 | - | - | - | - | - | 0.835 | 0.808 | 0.838 | 0.856 |
| 2000 | 0.868 | 0.951 | 1.069 | W | - | - | - | - | 1.075 | 1.054 | 1.014 | 0.897 |
| 2001 | 0.967 | 0.980 | 0.948 | W | W | - | - | - | 0.931 | 0.858 | 0.764 | 0.708 |
| 2002 | 0.716 | 0.725 | 0.880 | W | - | - | - | - | 1.020 | 1.057 | 0.977 | 0.974 |
| 2003 | 1.055 | 1.199 | 1.212 | - | - | - | - | - | 1.046 | 1.101 | 1.036 | 1.039 |
| 2004 | 1.135 | 1.175 | 1.241 | - | - | - | - | - | 1.485 | 1.537 | 1.466 | 1.301 |
| 2005 | 1.359 | 1.444 | 1.658 | - | - | - | - | NA | 2.314 | 2.069 | 1.806 | 1.803 |
| 2006 | 1.895 | 1.823 | 2.021 | - | - | - | - | - | 1.955 | 1.753 | 1.750 | 1.781 |
| - = No Data Reported; -- = Not Applicable; NA = Not Available; W = Withheld to avoid disclosure of individual company data. |
| Release Date: 6/1/2022 |
| Next Release Date: TBD |