|
Download Data (XLS File) |
|
||||||||
|
||||||||
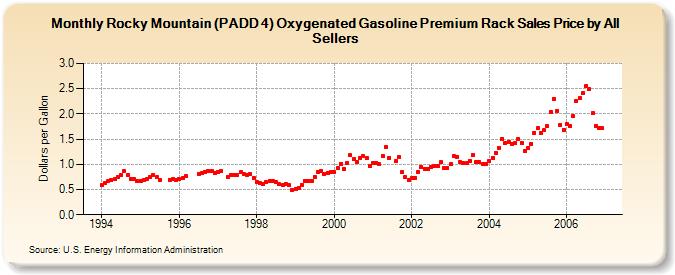
| Rocky Mountain (PADD 4) Oxygenated Gasoline Premium Rack Sales Price by All Sellers (Dollars per Gallon) | ||||||||
| Year | Jan | Feb | Mar | Apr | May | Jun | Jul | Aug | Sep | Oct | Nov | Dec |
|---|---|---|---|---|---|---|---|---|---|---|---|---|
| 1994 | 0.599 | 0.636 | 0.660 | 0.680 | 0.701 | 0.742 | 0.784 | 0.865 | 0.785 | 0.716 | 0.715 | 0.659 |
| 1995 | 0.676 | 0.689 | 0.703 | 0.741 | 0.791 | 0.741 | 0.690 | NA | W | 0.698 | 0.703 | 0.682 |
| 1996 | 0.703 | 0.727 | 0.767 | W | NA | NA | 0.808 | 0.820 | 0.853 | 0.872 | 0.864 | 0.833 |
| 1997 | 0.846 | 0.858 | NA | 0.749 | 0.783 | 0.781 | 0.792 | 0.841 | 0.811 | 0.797 | 0.806 | 0.735 |
| 1998 | 0.658 | 0.629 | 0.611 | 0.641 | 0.673 | 0.661 | 0.645 | 0.604 | 0.587 | 0.615 | 0.580 | 0.492 |
| 1999 | 0.518 | 0.537 | 0.597 | 0.677 | 0.670 | 0.676 | 0.756 | 0.850 | 0.870 | 0.816 | 0.834 | 0.838 |
| 2000 | 0.847 | 0.928 | 1.013 | 0.907 | 1.024 | 1.177 | 1.098 | 1.046 | 1.120 | 1.156 | 1.122 | 0.971 |
| 2001 | 1.027 | 1.035 | 0.998 | 1.163 | 1.346 | 1.126 | NA | 1.064 | 1.149 | 0.842 | 0.743 | 0.686 |
| 2002 | 0.720 | 0.730 | 0.850 | 0.944 | 0.916 | 0.899 | 0.942 | 0.957 | 0.975 | 1.037 | 0.935 | 0.935 |
| 2003 | 0.998 | 1.156 | 1.153 | 1.038 | 1.023 | 1.019 | 1.073 | 1.194 | 1.052 | 1.042 | 1.004 | 1.002 |
| 2004 | 1.075 | 1.129 | 1.225 | 1.333 | 1.507 | 1.418 | 1.451 | 1.404 | 1.421 | 1.502 | 1.430 | 1.270 |
| 2005 | 1.332 | 1.405 | 1.624 | 1.715 | 1.626 | 1.678 | 1.754 | 2.040 | 2.304 | 2.051 | 1.782 | 1.688 |
| 2006 | 1.790 | 1.751 | 1.951 | 2.260 | 2.306 | 2.411 | 2.547 | 2.488 | 2.012 | 1.757 | 1.720 | 1.713 |
| - = No Data Reported; -- = Not Applicable; NA = Not Available; W = Withheld to avoid disclosure of individual company data. |
| Release Date: 6/1/2022 |
| Next Release Date: TBD |