|
Download Data (XLS File) |
|
||||||||
|
||||||||
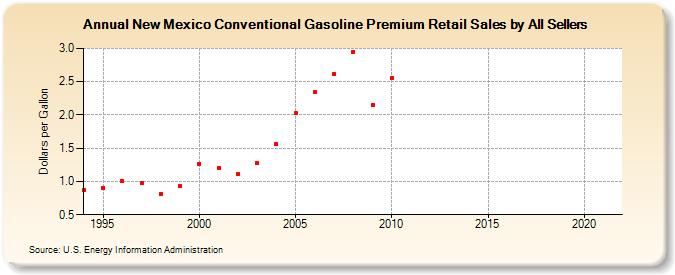
| New Mexico Conventional Gasoline Premium Retail Sales by All Sellers (Dollars per Gallon) | ||||||||
| Decade | Year-0 | Year-1 | Year-2 | Year-3 | Year-4 | Year-5 | Year-6 | Year-7 | Year-8 | Year-9 |
|---|---|---|---|---|---|---|---|---|---|---|
| 1990's | 0.869 | 0.909 | 1.006 | 0.973 | 0.814 | 0.935 | ||||
| 2000's | 1.265 | 1.208 | 1.119 | 1.275 | 1.557 | 2.023 | 2.344 | 2.621 | 2.948 | 2.151 |
| 2010's | 2.559 | - | - | - | - | - | - | - | - | - |
| 2020's | - |
| - = No Data Reported; -- = Not Applicable; NA = Not Available; W = Withheld to avoid disclosure of individual company data. |
| Release Date: 6/1/2022 |
| Next Release Date: TBD |