|
Download Data (XLS File) |
|
||||||||
|
||||||||
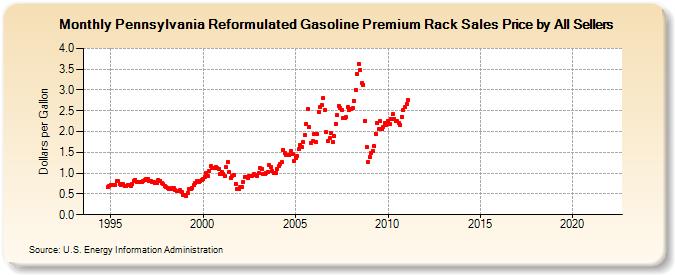
| Pennsylvania Reformulated Gasoline Premium Rack Sales Price by All Sellers (Dollars per Gallon) | ||||||||
| Year | Jan | Feb | Mar | Apr | May | Jun | Jul | Aug | Sep | Oct | Nov | Dec |
|---|---|---|---|---|---|---|---|---|---|---|---|---|
| 1994 | - | - | - | - | - | - | - | - | - | - | 0.658 | 0.697 |
| 1995 | 0.719 | 0.720 | 0.706 | 0.726 | 0.817 | 0.800 | 0.744 | 0.723 | 0.732 | 0.685 | 0.680 | 0.716 |
| 1996 | 0.716 | 0.700 | 0.747 | 0.820 | 0.846 | 0.781 | 0.789 | 0.787 | 0.787 | 0.805 | 0.838 | 0.855 |
| 1997 | 0.849 | 0.821 | 0.800 | 0.781 | 0.785 | 0.772 | 0.767 | 0.838 | 0.817 | 0.766 | 0.729 | 0.699 |
| 1998 | 0.660 | 0.633 | 0.617 | 0.625 | 0.654 | 0.639 | 0.590 | 0.569 | 0.575 | 0.588 | 0.539 | 0.470 |
| 1999 | 0.475 | 0.455 | 0.528 | 0.620 | 0.629 | 0.633 | 0.707 | 0.761 | 0.815 | 0.789 | 0.805 | 0.838 |
| 2000 | 0.849 | 0.911 | 1.008 | 0.934 | 1.059 | 1.162 | 1.133 | 1.113 | 1.148 | 1.120 | 1.110 | 0.984 |
| 2001 | 1.025 | 0.989 | 0.932 | 1.148 | 1.265 | 1.037 | 0.891 | 0.937 | 0.954 | 0.748 | 0.620 | 0.615 |
| 2002 | 0.661 | 0.663 | 0.793 | 0.907 | 0.902 | 0.875 | 0.925 | 0.935 | 0.935 | 0.979 | 0.945 | 0.939 |
| 2003 | 1.001 | 1.122 | 1.098 | 0.990 | 0.979 | 0.997 | 1.028 | 1.188 | 1.157 | 1.053 | 1.006 | 0.992 |
| 2004 | 1.097 | 1.165 | 1.226 | 1.258 | 1.564 | 1.473 | 1.445 | 1.437 | 1.426 | 1.537 | 1.450 | 1.282 |
| 2005 | 1.369 | 1.403 | 1.570 | 1.685 | 1.627 | 1.745 | 1.922 | 2.170 | 2.539 | 2.102 | 1.720 | 1.764 |
| 2006 | 1.937 | 1.746 | 1.945 | 2.482 | 2.599 | 2.642 | 2.805 | 2.513 | 1.978 | 1.773 | 1.836 | 1.954 |
| 2007 | 1.747 | 1.883 | 2.193 | 2.396 | 2.619 | 2.572 | 2.529 | 2.314 | 2.320 | 2.342 | 2.588 | 2.529 |
| 2008 | 2.546 | 2.565 | 2.745 | 3.001 | 3.381 | 3.631 | 3.488 | 3.159 | 3.130 | 2.263 | 1.631 | 1.271 |
| 2009 | 1.384 | 1.491 | 1.541 | 1.641 | 1.948 | 2.203 | 2.055 | 2.248 | 2.061 | 2.119 | 2.208 | 2.163 |
| 2010 | 2.263 | 2.173 | 2.304 | 2.412 | 2.310 | 2.258 | 2.244 | 2.199 | 2.165 | 2.357 | 2.512 | 2.588 |
| 2011 | 2.667 | 2.752 | - | - | - | - | - | - | - | - | - | - |
| 2012 | - | - | - | - | - | - | - | - | - | - | - | - |
| 2013 | - | - | - | - | - | - | - | - | - | - | - | - |
| 2014 | - | - | - | - | - | - | - | - | - | - | - | - |
| 2015 | - | - | - | - | - | - | - | - | - | - | - | - |
| 2016 | - | - | - | - | - | - | - | - | - | - | - | - |
| 2017 | - | - | - | - | - | - | - | - | - | - | - | - |
| 2018 | - | - | - | - | - | - | - | - | - | - | - | - |
| 2019 | - | - | - | - | - | - | - | - | - | - | - | - |
| 2020 | - | - | - | - | - | - | - | - | - | - | - | - |
| 2021 | - | - | - | - | - | - | - | - | - | - | - | - |
| 2022 | - | - | - | |||||||||
| - = No Data Reported; -- = Not Applicable; NA = Not Available; W = Withheld to avoid disclosure of individual company data. |
| Release Date: 6/1/2022 |
| Next Release Date: TBD |