|
Download Data (XLS File) |
|
||||||||
|
||||||||
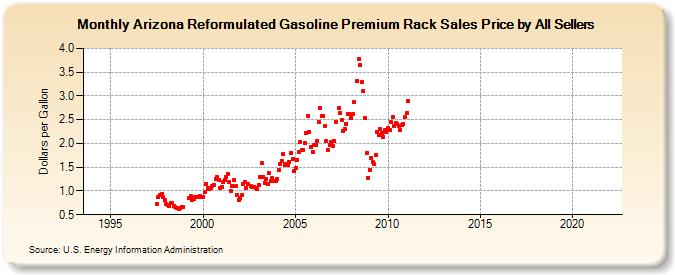
| Arizona Reformulated Gasoline Premium Rack Sales Price by All Sellers (Dollars per Gallon) | ||||||||
| Year | Jan | Feb | Mar | Apr | May | Jun | Jul | Aug | Sep | Oct | Nov | Dec |
|---|---|---|---|---|---|---|---|---|---|---|---|---|
| 1994 | - | - | - | - | - | - | - | - | - | - | - | - |
| 1995 | - | - | - | - | - | - | - | - | - | - | - | - |
| 1996 | - | - | - | - | - | - | - | - | - | - | - | - |
| 1997 | - | - | - | - | - | - | 0.727 | 0.870 | 0.911 | 0.938 | 0.863 | 0.812 |
| 1998 | 0.734 | 0.700 | 0.673 | 0.757 | 0.741 | 0.685 | 0.653 | 0.637 | 0.627 | 0.642 | 0.658 | 0.656 |
| 1999 | W | W | W | 0.845 | 0.896 | 0.814 | 0.827 | 0.876 | 0.878 | 0.882 | 0.895 | 0.879 |
| 2000 | 0.879 | 0.969 | 1.155 | 1.059 | 1.050 | 1.053 | 1.111 | 1.132 | 1.249 | 1.301 | 1.238 | 1.067 |
| 2001 | 1.081 | 1.191 | 1.228 | 1.304 | 1.366 | 1.196 | 1.008 | 1.107 | 1.228 | 1.098 | 0.921 | 0.810 |
| 2002 | 0.857 | 0.908 | 1.143 | 1.186 | 1.072 | 1.140 | NA | 1.095 | 1.078 | 1.089 | 1.061 | 1.042 |
| 2003 | 1.126 | 1.292 | 1.579 | 1.303 | 1.174 | 1.246 | 1.146 | 1.375 | 1.204 | 1.264 | 1.208 | 1.204 |
| 2004 | 1.254 | 1.444 | 1.575 | 1.640 | 1.776 | 1.551 | 1.564 | 1.555 | 1.618 | 1.800 | 1.664 | 1.414 |
| 2005 | 1.492 | 1.657 | 1.826 | 2.024 | 1.871 | 1.861 | 2.017 | 2.212 | 2.576 | 2.251 | 1.934 | 1.827 |
| 2006 | 1.965 | 1.958 | 2.053 | 2.449 | 2.754 | 2.569 | 2.583 | 2.364 | 2.043 | 1.866 | 1.971 | 2.037 |
| 2007 | 1.947 | 2.047 | 2.453 | NA | 2.749 | 2.650 | 2.499 | 2.261 | 2.301 | 2.419 | 2.628 | 2.621 |
| 2008 | 2.541 | 2.613 | 2.864 | NA | 3.319 | 3.784 | 3.646 | 3.293 | 3.105 | 2.530 | 1.806 | 1.283 |
| 2009 | 1.450 | 1.692 | 1.614 | 1.562 | 1.765 | 2.239 | 2.179 | 2.304 | 2.225 | 2.142 | 2.277 | 2.245 |
| 2010 | 2.317 | 2.292 | 2.457 | 2.546 | 2.370 | 2.437 | 2.411 | 2.360 | 2.281 | 2.391 | 2.417 | 2.549 |
| 2011 | 2.641 | 2.892 | - | - | - | - | - | - | - | - | - | - |
| 2012 | - | - | - | - | - | - | - | - | - | - | - | - |
| 2013 | - | - | - | - | - | - | - | - | - | - | - | - |
| 2014 | - | - | - | - | - | - | - | - | - | - | - | - |
| 2015 | - | - | - | - | - | - | - | - | - | - | - | - |
| 2016 | - | - | - | - | - | - | - | - | - | - | - | - |
| 2017 | - | - | - | - | - | - | - | - | - | - | - | - |
| 2018 | - | - | - | - | - | - | - | - | - | - | - | - |
| 2019 | - | - | - | - | - | - | - | - | - | - | - | - |
| 2020 | - | - | - | - | - | - | - | - | - | - | - | - |
| 2021 | - | - | - | - | - | - | - | - | - | - | - | - |
| 2022 | - | - | - | |||||||||
| - = No Data Reported; -- = Not Applicable; NA = Not Available; W = Withheld to avoid disclosure of individual company data. |
| Release Date: 6/1/2022 |
| Next Release Date: TBD |