|
Download Data (XLS File) |
|
||||||||
|
||||||||
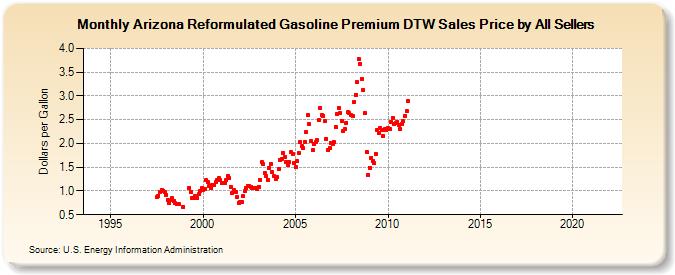
| Arizona Reformulated Gasoline Premium DTW Sales Price by All Sellers (Dollars per Gallon) | ||||||||
| Year | Jan | Feb | Mar | Apr | May | Jun | Jul | Aug | Sep | Oct | Nov | Dec |
|---|---|---|---|---|---|---|---|---|---|---|---|---|
| 1994 | - | - | - | - | - | - | - | - | - | - | - | - |
| 1995 | - | - | - | - | - | - | - | - | - | - | - | - |
| 1996 | - | - | - | - | - | - | - | - | - | - | - | - |
| 1997 | - | - | - | - | - | W | 0.871 | 0.903 | 0.984 | 1.018 | 1.006 | 0.969 |
| 1998 | 0.918 | 0.810 | 0.750 | 0.800 | 0.843 | 0.798 | 0.736 | 0.715 | 0.715 | NA | W | 0.668 |
| 1999 | NA | NA | NA | 1.071 | 0.984 | 0.858 | 0.851 | 0.885 | 0.849 | 0.930 | 0.994 | 1.056 |
| 2000 | 1.030 | 1.050 | 1.221 | 1.189 | 1.100 | 1.060 | 1.126 | 1.123 | 1.179 | 1.234 | 1.272 | 1.224 |
| 2001 | 1.160 | 1.168 | 1.168 | 1.223 | 1.315 | 1.266 | 1.088 | 0.963 | 1.016 | 0.985 | 0.875 | 0.748 |
| 2002 | 0.770 | 0.762 | 0.888 | 0.995 | 1.058 | 1.109 | 1.107 | 1.084 | 1.059 | 1.064 | 1.072 | 1.040 |
| 2003 | 1.089 | 1.233 | 1.605 | 1.564 | 1.382 | 1.307 | 1.241 | 1.492 | 1.571 | 1.392 | 1.305 | 1.245 |
| 2004 | 1.288 | 1.453 | 1.660 | 1.672 | 1.805 | 1.724 | 1.604 | 1.555 | 1.609 | 1.816 | 1.775 | 1.584 |
| 2005 | 1.498 | 1.621 | 1.800 | 2.020 | 1.945 | 1.896 | 2.036 | 2.233 | 2.598 | 2.402 | 2.047 | 1.854 |
| 2006 | 1.981 | 2.027 | 2.062 | 2.484 | 2.749 | 2.588 | 2.587 | 2.477 | 2.099 | 1.866 | 1.903 | 2.015 |
| 2007 | 1.994 | 2.025 | 2.349 | 2.622 | 2.756 | 2.636 | 2.476 | 2.266 | 2.300 | 2.437 | 2.653 | 2.634 |
| 2008 | 2.590 | 2.586 | 2.873 | 3.027 | 3.286 | 3.767 | 3.682 | 3.357 | 3.127 | 2.637 | 1.824 | 1.335 |
| 2009 | 1.491 | 1.700 | 1.640 | 1.587 | 1.788 | 2.292 | 2.219 | 2.333 | 2.284 | 2.160 | 2.306 | 2.290 |
| 2010 | 2.325 | 2.300 | 2.459 | 2.542 | 2.399 | 2.428 | 2.450 | 2.398 | 2.300 | 2.416 | 2.463 | 2.586 |
| 2011 | 2.677 | 2.884 | - | - | - | - | - | - | - | - | - | - |
| 2012 | - | - | - | - | - | - | - | - | - | - | - | - |
| 2013 | - | - | - | - | - | - | - | - | - | - | - | - |
| 2014 | - | - | - | - | - | - | - | - | - | - | - | - |
| 2015 | - | - | - | - | - | - | - | - | - | - | - | - |
| 2016 | - | - | - | - | - | - | - | - | - | - | - | - |
| 2017 | - | - | - | - | - | - | - | - | - | - | - | - |
| 2018 | - | - | - | - | - | - | - | - | - | - | - | - |
| 2019 | - | - | - | - | - | - | - | - | - | - | - | - |
| 2020 | - | - | - | - | - | - | - | - | - | - | - | - |
| 2021 | - | - | - | - | - | - | - | - | - | - | - | - |
| 2022 | - | - | - | |||||||||
| - = No Data Reported; -- = Not Applicable; NA = Not Available; W = Withheld to avoid disclosure of individual company data. |
| Release Date: 6/1/2022 |
| Next Release Date: TBD |