|
Download Data (XLS File) |
|
||||||||
|
||||||||
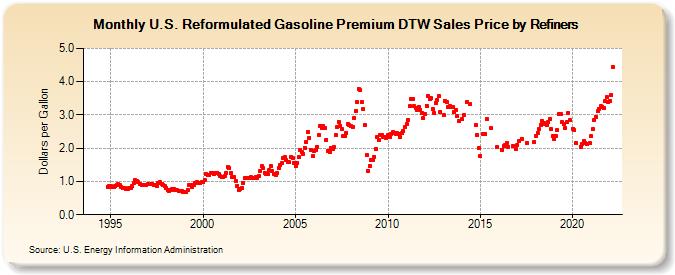
| U.S. Reformulated Gasoline Premium DTW Sales Price by Refiners (Dollars per Gallon) | ||||||||
| Year | Jan | Feb | Mar | Apr | May | Jun | Jul | Aug | Sep | Oct | Nov | Dec |
|---|---|---|---|---|---|---|---|---|---|---|---|---|
| 1994 | - | - | - | - | - | - | - | - | - | - | 0.846 | 0.863 |
| 1995 | 0.857 | 0.845 | 0.835 | 0.851 | 0.903 | 0.914 | 0.879 | 0.834 | 0.817 | 0.803 | 0.778 | 0.787 |
| 1996 | 0.806 | 0.812 | 0.855 | 0.957 | 1.030 | 1.004 | 0.969 | 0.923 | 0.898 | 0.889 | 0.886 | 0.891 |
| 1997 | 0.913 | 0.911 | 0.911 | 0.919 | 0.903 | 0.889 | 0.868 | 0.943 | 0.971 | 0.937 | 0.903 | 0.865 |
| 1998 | 0.817 | 0.754 | 0.707 | 0.728 | 0.776 | 0.768 | 0.753 | 0.734 | 0.721 | 0.727 | 0.718 | 0.697 |
| 1999 | 0.696 | 0.678 | 0.743 | 0.899 | 0.893 | 0.847 | 0.887 | 0.962 | 0.969 | 0.961 | 0.952 | 0.971 |
| 2000 | 0.971 | 1.036 | 1.211 | 1.207 | 1.187 | 1.256 | 1.267 | 1.213 | 1.267 | 1.260 | 1.235 | 1.170 |
| 2001 | 1.134 | 1.146 | 1.151 | 1.268 | 1.436 | 1.399 | 1.258 | 1.134 | 1.147 | 1.021 | 0.871 | 0.744 |
| 2002 | 0.774 | 0.809 | 0.961 | 1.111 | 1.108 | 1.106 | 1.109 | 1.126 | 1.114 | 1.108 | 1.129 | 1.099 |
| 2003 | 1.168 | 1.318 | 1.450 | 1.397 | 1.267 | 1.219 | 1.215 | 1.347 | 1.455 | 1.311 | 1.232 | 1.181 |
| 2004 | 1.257 | 1.390 | 1.508 | 1.547 | 1.703 | 1.727 | 1.644 | 1.579 | 1.576 | 1.748 | 1.716 | 1.556 |
| 2005 | 1.470 | 1.567 | 1.730 | 1.941 | 1.882 | 1.837 | 1.999 | 2.186 | 2.472 | 2.314 | 1.949 | 1.770 |
| 2006 | 1.928 | 1.957 | 2.048 | 2.400 | 2.681 | 2.620 | 2.667 | 2.606 | 2.256 | 1.926 | 1.889 | 1.996 |
| 2007 | 1.976 | 2.028 | 2.389 | 2.622 | 2.794 | 2.677 | 2.569 | 2.361 | 2.371 | 2.465 | 2.729 | 2.683 |
| 2008 | 2.658 | 2.627 | 2.914 | 3.116 | 3.380 | 3.791 | 3.742 | 3.386 | 3.169 | 2.694 | 1.795 | 1.328 |
| 2009 | 1.475 | 1.655 | 1.641 | 1.749 | 1.971 | 2.340 | 2.258 | 2.382 | 2.398 | 2.331 | 2.342 | 2.311 |
| 2010 | 2.396 | 2.333 | 2.438 | 2.476 | 2.465 | 2.437 | 2.454 | 2.440 | 2.330 | 2.453 | 2.514 | 2.634 |
| 2011 | 2.718 | 2.860 | 3.255 | 3.491 | 3.490 | 3.260 | 3.194 | 3.139 | 3.252 | 3.148 | 3.066 | 2.904 |
| 2012 | 3.026 | 3.276 | 3.570 | 3.491 | 3.504 | 3.164 | 3.060 | 3.353 | 3.451 | 3.558 | 3.092 | W |
| 2013 | 2.989 | 3.422 | 3.381 | 3.227 | 3.261 | 3.245 | 3.238 | 3.086 | 3.147 | 2.964 | 2.828 | NA |
| 2014 | 2.873 | 2.985 | W | 3.395 | W | 3.334 | W | W | W | 2.685 | 2.395 | 2.005 |
| 2015 | 1.758 | W | 2.429 | 2.420 | 2.877 | W | W | 2.612 | W | W | W | 2.029 |
| 2016 | W | W | 1.960 | 2.064 | 2.091 | 2.160 | 2.045 | W | W | 2.070 | W | 1.968 |
| 2017 | 2.104 | 2.210 | W | 2.286 | W | W | 2.155 | W | W | W | W | 2.191 |
| 2018 | 2.368 | 2.458 | 2.566 | 2.695 | 2.819 | 2.756 | 2.720 | 2.685 | 2.779 | 2.882 | 2.573 | 2.356 |
| 2019 | 2.280 | 2.371 | 2.537 | 3.028 | 3.027 | 2.782 | 2.720 | 2.611 | 2.775 | 3.058 | 2.834 | W |
| 2020 | 2.589 | 2.542 | 2.154 | W | W | 2.048 | 2.137 | 2.205 | 2.168 | 2.112 | W | 2.148 |
| 2021 | 2.359 | 2.567 | 2.846 | 2.952 | 3.104 | 3.191 | 3.254 | 3.250 | 3.214 | 3.406 | 3.537 | 3.403 |
| 2022 | 3.429 | 3.599 | 4.455 | |||||||||
| - = No Data Reported; -- = Not Applicable; NA = Not Available; W = Withheld to avoid disclosure of individual company data. |
| Release Date: 6/1/2022 |
| Next Release Date: TBD |
Referring Pages: