|
Download Data (XLS File) |
|
||||||||
|
||||||||
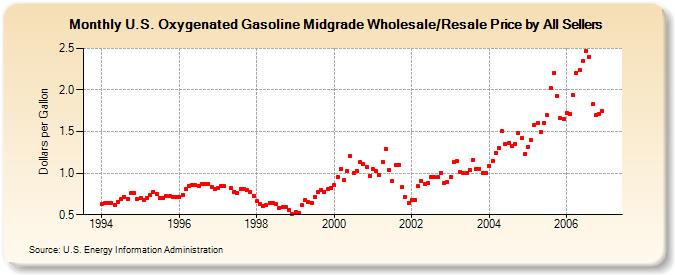
| U.S. Oxygenated Gasoline Midgrade Wholesale/Resale Price by All Sellers (Dollars per Gallon) | ||||||||
| Year | Jan | Feb | Mar | Apr | May | Jun | Jul | Aug | Sep | Oct | Nov | Dec |
|---|---|---|---|---|---|---|---|---|---|---|---|---|
| 1994 | 0.626 | 0.636 | 0.635 | 0.644 | 0.617 | 0.657 | 0.689 | 0.718 | 0.689 | 0.759 | 0.759 | 0.685 |
| 1995 | 0.700 | 0.682 | 0.701 | 0.738 | 0.777 | 0.750 | 0.696 | 0.698 | 0.724 | 0.722 | 0.710 | 0.712 |
| 1996 | 0.718 | 0.738 | 0.811 | 0.849 | 0.862 | 0.858 | 0.847 | 0.867 | 0.874 | 0.872 | 0.834 | 0.807 |
| 1997 | 0.826 | 0.841 | 0.844 | NA | 0.816 | 0.772 | 0.759 | 0.813 | 0.815 | 0.793 | 0.775 | 0.728 |
| 1998 | 0.661 | 0.633 | 0.602 | 0.611 | 0.645 | 0.635 | 0.625 | 0.585 | 0.591 | 0.594 | 0.559 | 0.507 |
| 1999 | 0.528 | 0.522 | 0.611 | 0.673 | 0.652 | 0.645 | 0.713 | 0.771 | 0.800 | 0.778 | 0.810 | 0.822 |
| 2000 | 0.852 | 0.959 | 1.049 | 0.915 | 1.031 | 1.201 | 0.999 | 1.023 | 1.128 | 1.106 | 1.073 | 0.970 |
| 2001 | 1.046 | 1.025 | 0.973 | 1.137 | 1.288 | 1.039 | 0.904 | 1.094 | 1.102 | 0.829 | 0.715 | 0.643 |
| 2002 | 0.672 | 0.676 | 0.842 | 0.905 | 0.874 | 0.882 | 0.950 | 0.949 | 0.951 | 1.006 | 0.886 | 0.890 |
| 2003 | 0.951 | 1.135 | 1.148 | 1.015 | 0.998 | 0.998 | 1.043 | 1.162 | 1.050 | 1.053 | 0.999 | 1.003 |
| 2004 | 1.087 | 1.147 | 1.238 | 1.301 | 1.501 | 1.351 | 1.359 | 1.325 | 1.353 | 1.488 | 1.424 | 1.234 |
| 2005 | 1.317 | 1.394 | 1.576 | 1.599 | 1.496 | 1.600 | 1.695 | 2.021 | 2.203 | 1.930 | 1.658 | 1.648 |
| 2006 | 1.727 | 1.710 | 1.940 | 2.209 | 2.240 | 2.346 | 2.468 | 2.395 | 1.827 | 1.694 | 1.712 | 1.746 |
| - = No Data Reported; -- = Not Applicable; NA = Not Available; W = Withheld to avoid disclosure of individual company data. |
| Release Date: 6/1/2022 |
| Next Release Date: TBD |