|
Download Data (XLS File) |
|
||||||||
|
||||||||
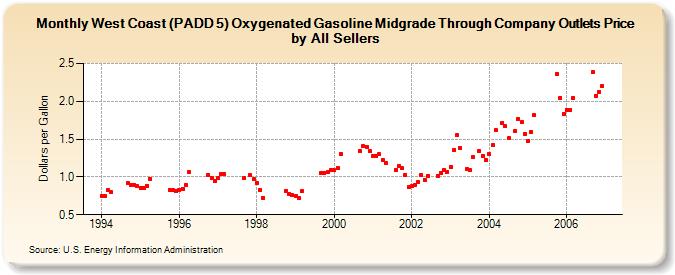
| West Coast (PADD 5) Oxygenated Gasoline Midgrade Through Company Outlets Price by All Sellers (Dollars per Gallon) | ||||||||
| Year | Jan | Feb | Mar | Apr | May | Jun | Jul | Aug | Sep | Oct | Nov | Dec |
|---|---|---|---|---|---|---|---|---|---|---|---|---|
| 1994 | 0.753 | 0.745 | 0.822 | 0.795 | - | W | W | - | 0.919 | 0.895 | 0.898 | 0.874 |
| 1995 | 0.855 | 0.854 | 0.886 | 0.978 | W | W | W | W | NA | 0.831 | 0.821 | 0.810 |
| 1996 | 0.830 | 0.845 | 0.899 | 1.061 | W | W | W | W | NA | 1.027 | 0.989 | 0.943 |
| 1997 | 0.980 | 1.041 | 1.036 | W | W | W | W | W | 0.983 | NA | 1.025 | 0.967 |
| 1998 | 0.924 | 0.831 | 0.727 | W | W | W | W | W | W | 0.816 | 0.774 | 0.759 |
| 1999 | 0.752 | 0.718 | 0.810 | W | W | W | W | W | 1.046 | 1.053 | 1.061 | 1.092 |
| 2000 | 1.088 | 1.123 | 1.304 | W | W | W | W | W | 1.337 | 1.404 | 1.401 | 1.339 |
| 2001 | 1.279 | 1.274 | 1.298 | 1.229 | 1.180 | W | W | 1.096 | 1.144 | 1.112 | 1.031 | 0.864 |
| 2002 | 0.878 | 0.896 | 0.932 | 1.030 | 0.964 | 1.014 | NA | NA | 1.016 | 1.058 | 1.097 | 1.067 |
| 2003 | 1.133 | 1.355 | 1.549 | 1.385 | NA | 1.102 | 1.085 | 1.267 | NA | 1.340 | 1.278 | 1.228 |
| 2004 | 1.302 | 1.419 | 1.615 | NA | 1.717 | 1.669 | 1.509 | NA | 1.610 | 1.763 | 1.725 | 1.574 |
| 2005 | 1.479 | 1.599 | 1.816 | W | W | W | W | W | W | 2.364 | 2.046 | 1.836 |
| 2006 | 1.891 | 1.882 | 2.049 | W | W | W | W | W | 2.387 | 2.075 | 2.123 | 2.202 |
| - = No Data Reported; -- = Not Applicable; NA = Not Available; W = Withheld to avoid disclosure of individual company data. |
| Release Date: 6/1/2022 |
| Next Release Date: TBD |