|
Download Data (XLS File) |
|
||||||||
|
||||||||
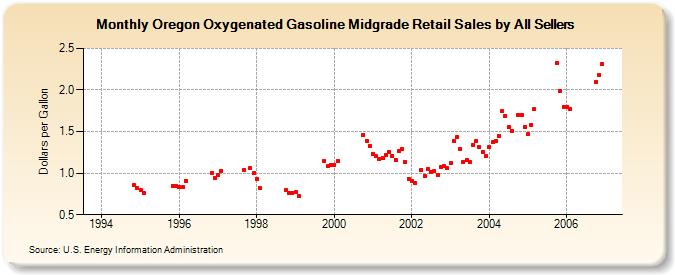
| Oregon Oxygenated Gasoline Midgrade Retail Sales by All Sellers (Dollars per Gallon) | ||||||||
| Year | Jan | Feb | Mar | Apr | May | Jun | Jul | Aug | Sep | Oct | Nov | Dec |
|---|---|---|---|---|---|---|---|---|---|---|---|---|
| 1994 | W | W | W | - | - | - | - | - | - | W | 0.853 | 0.816 |
| 1995 | 0.794 | 0.761 | - | - | - | - | - | - | W | NA | 0.849 | 0.842 |
| 1996 | 0.837 | 0.829 | 0.910 | W | W | NA | NA | NA | NA | NA | 1.005 | 0.941 |
| 1997 | 0.973 | 1.026 | W | W | W | W | W | W | 1.036 | NA | 1.061 | 0.996 |
| 1998 | 0.930 | 0.822 | W | W | W | W | W | W | W | 0.794 | 0.766 | 0.762 |
| 1999 | 0.768 | 0.720 | NA | W | W | W | W | W | W | 1.143 | 1.080 | 1.095 |
| 2000 | 1.099 | 1.148 | W | W | W | W | W | W | W | 1.462 | 1.391 | 1.331 |
| 2001 | 1.235 | 1.202 | 1.169 | 1.187 | 1.224 | 1.259 | 1.210 | 1.161 | 1.269 | 1.296 | 1.136 | 0.934 |
| 2002 | 0.902 | 0.878 | NA | 1.037 | 0.967 | 1.045 | 1.017 | 1.020 | 0.980 | 1.075 | 1.081 | 1.058 |
| 2003 | 1.116 | 1.386 | 1.429 | 1.293 | 1.138 | 1.154 | 1.137 | 1.343 | 1.383 | 1.309 | 1.259 | 1.203 |
| 2004 | 1.310 | 1.373 | 1.381 | 1.451 | 1.744 | 1.693 | 1.550 | 1.512 | NA | 1.700 | 1.701 | 1.553 |
| 2005 | 1.465 | 1.582 | 1.768 | W | W | W | W | W | W | 2.325 | 1.992 | 1.793 |
| 2006 | 1.800 | 1.768 | W | W | W | W | W | W | W | 2.100 | 2.177 | 2.314 |
| - = No Data Reported; -- = Not Applicable; NA = Not Available; W = Withheld to avoid disclosure of individual company data. |
| Release Date: 6/1/2022 |
| Next Release Date: TBD |