|
Download Data (XLS File) |
|
||||||||
|
||||||||
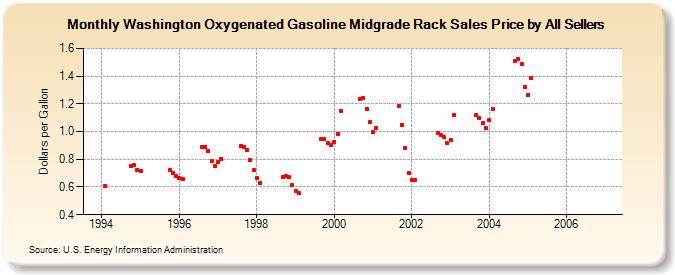
| Washington Oxygenated Gasoline Midgrade Rack Sales Price by All Sellers (Dollars per Gallon) | ||||||||
| Year | Jan | Feb | Mar | Apr | May | Jun | Jul | Aug | Sep | Oct | Nov | Dec |
|---|---|---|---|---|---|---|---|---|---|---|---|---|
| 1994 | W | 0.610 | W | W | - | - | - | - | W | 0.754 | 0.757 | 0.725 |
| 1995 | 0.712 | W | - | - | - | - | - | W | NA | 0.721 | 0.702 | 0.682 |
| 1996 | 0.666 | 0.657 | - | - | - | - | - | 0.887 | 0.887 | 0.861 | 0.786 | 0.751 |
| 1997 | 0.779 | 0.805 | - | W | W | W | W | 0.899 | 0.891 | 0.869 | 0.798 | 0.723 |
| 1998 | 0.664 | 0.626 | W | W | W | W | W | W | 0.673 | 0.681 | 0.672 | 0.612 |
| 1999 | 0.573 | 0.554 | W | W | W | W | W | W | 0.944 | 0.946 | 0.915 | 0.904 |
| 2000 | 0.928 | 0.983 | 1.148 | W | W | W | W | W | 1.233 | 1.241 | 1.165 | 1.067 |
| 2001 | 0.996 | 1.027 | W | W | W | W | W | W | 1.181 | 1.048 | 0.881 | 0.701 |
| 2002 | 0.654 | 0.651 | W | NA | W | W | NA | W | 0.991 | 0.976 | 0.960 | 0.919 |
| 2003 | 0.942 | 1.118 | W | W | W | W | W | W | 1.117 | 1.098 | 1.062 | 1.023 |
| 2004 | 1.082 | 1.165 | - | - | - | - | - | - | 1.507 | 1.526 | 1.486 | 1.318 |
| 2005 | 1.267 | 1.386 | - | - | - | - | - | - | - | - | - | - |
| 2006 | - | - | - | - | - | - | - | - | - | - | - | - |
| - = No Data Reported; -- = Not Applicable; NA = Not Available; W = Withheld to avoid disclosure of individual company data. |
| Release Date: 6/1/2022 |
| Next Release Date: TBD |