|
Download Data (XLS File) |
|
||||||||
|
||||||||
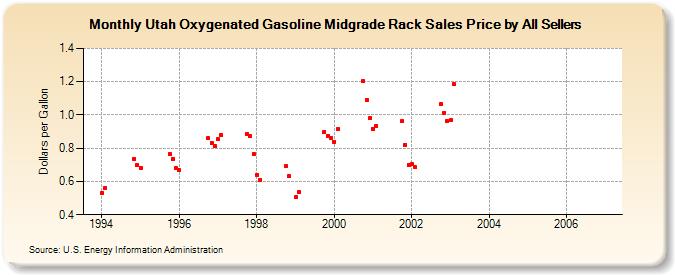
| Utah Oxygenated Gasoline Midgrade Rack Sales Price by All Sellers (Dollars per Gallon) | ||||||||
| Year | Jan | Feb | Mar | Apr | May | Jun | Jul | Aug | Sep | Oct | Nov | Dec |
|---|---|---|---|---|---|---|---|---|---|---|---|---|
| 1994 | 0.533 | 0.563 | - | - | - | - | - | - | W | W | 0.735 | 0.698 |
| 1995 | 0.683 | W | - | - | - | - | - | - | - | 0.764 | 0.737 | 0.678 |
| 1996 | 0.669 | - | - | - | - | - | - | - | W | 0.861 | 0.832 | 0.812 |
| 1997 | 0.853 | 0.879 | - | - | - | - | - | - | - | 0.886 | 0.872 | 0.768 |
| 1998 | 0.641 | 0.611 | - | - | - | - | - | - | - | 0.692 | 0.631 | NA |
| 1999 | 0.504 | 0.539 | NA | - | - | - | - | - | - | 0.900 | 0.876 | 0.863 |
| 2000 | 0.839 | 0.916 | - | - | - | - | - | - | - | 1.202 | 1.092 | 0.979 |
| 2001 | 0.917 | 0.936 | - | - | - | - | - | - | - | 0.962 | 0.822 | 0.700 |
| 2002 | 0.704 | 0.685 | - | - | - | - | - | - | - | 1.064 | 1.013 | 0.964 |
| 2003 | 0.972 | 1.183 | - | - | - | - | - | - | - | W | W | W |
| 2004 | W | W | - | - | - | - | - | - | - | - | - | - |
| 2005 | - | - | - | - | - | - | - | - | - | - | - | - |
| 2006 | - | - | - | - | - | - | - | - | - | - | - | - |
| - = No Data Reported; -- = Not Applicable; NA = Not Available; W = Withheld to avoid disclosure of individual company data. |
| Release Date: 6/1/2022 |
| Next Release Date: TBD |