|
Download Data (XLS File) |
|
||||||||
|
||||||||
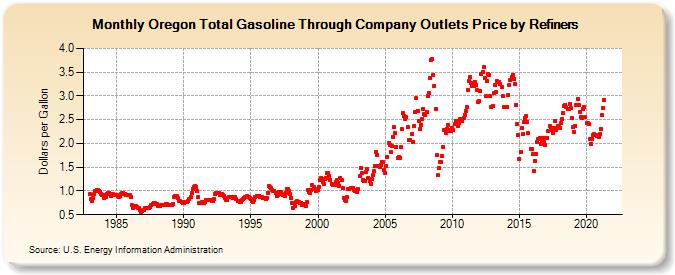
| Oregon Total Gasoline Through Company Outlets Price by Refiners (Dollars per Gallon) | ||||||||
| Year | Jan | Feb | Mar | Apr | May | Jun | Jul | Aug | Sep | Oct | Nov | Dec |
|---|---|---|---|---|---|---|---|---|---|---|---|---|
| 1983 | 0.927 | 0.826 | 0.793 | 0.843 | 0.932 | 0.990 | 1.025 | 1.024 | 1.005 | 0.969 | 0.939 | 0.923 |
| 1984 | 0.923 | 0.850 | 0.870 | 0.943 | 0.961 | 0.951 | 0.927 | 0.903 | 0.911 | 0.930 | 0.925 | 0.914 |
| 1985 | 0.907 | 0.889 | 0.876 | 0.895 | 0.938 | 0.961 | 0.955 | 0.937 | 0.921 | 0.912 | 0.908 | 0.915 |
| 1986 | 0.909 | 0.867 | 0.697 | 0.637 | 0.662 | 0.684 | 0.668 | 0.639 | 0.631 | 0.595 | 0.557 | 0.572 |
| 1987 | 0.596 | 0.636 | 0.643 | 0.641 | 0.643 | 0.646 | 0.662 | 0.700 | 0.733 | 0.744 | 0.740 | 0.729 |
| 1988 | 0.715 | 0.692 | 0.677 | 0.682 | 0.698 | 0.711 | 0.712 | 0.713 | 0.724 | 0.720 | 0.714 | 0.702 |
| 1989 | 0.698 | 0.708 | 0.728 | 0.883 | 0.901 | 0.901 | 0.888 | 0.843 | 0.797 | 0.786 | 0.776 | 0.749 |
| 1990 | 0.757 | 0.759 | 0.765 | 0.771 | 0.790 | 0.828 | 0.870 | 0.956 | 1.031 | 1.091 | 1.101 | 1.077 |
| 1991 | 1.006 | 0.883 | 0.751 | 0.744 | 0.761 | 0.770 | 0.742 | 0.774 | 0.815 | 0.816 | 0.813 | 0.802 |
| 1992 | 0.803 | 0.780 | 0.784 | 0.822 | 0.936 | 0.964 | 0.966 | 0.958 | 0.923 | 0.921 | 0.934 | 0.911 |
| 1993 | 0.885 | 0.851 | 0.806 | 0.820 | 0.865 | 0.877 | 0.876 | 0.868 | 0.862 | 0.881 | 0.864 | 0.823 |
| 1994 | 0.787 | 0.785 | 0.763 | 0.777 | 0.808 | 0.825 | 0.854 | 0.880 | 0.884 | 0.870 | 0.876 | 0.847 |
| 1995 | 0.823 | 0.799 | 0.769 | 0.802 | 0.872 | 0.894 | 0.900 | 0.894 | 0.873 | 0.877 | 0.876 | 0.856 |
| 1996 | 0.855 | 0.834 | 0.843 | 0.964 | 1.099 | 1.082 | 1.053 | 1.019 | 0.989 | 0.994 | 0.964 | 0.894 |
| 1997 | 0.915 | 0.979 | 0.927 | 0.968 | 0.941 | 0.916 | 0.891 | 0.962 | 1.034 | 1.038 | 0.994 | 0.928 |
| 1998 | 0.861 | 0.738 | 0.643 | 0.678 | 0.766 | 0.782 | 0.773 | 0.767 | 0.754 | 0.754 | 0.711 | 0.717 |
| 1999 | 0.717 | 0.674 | 0.776 | 1.022 | 0.969 | 0.949 | 1.026 | 1.122 | 1.088 | 1.039 | 0.996 | 1.026 |
| 2000 | 1.022 | 1.073 | 1.233 | 1.271 | 1.191 | 1.152 | 1.252 | 1.273 | 1.369 | 1.377 | 1.322 | 1.241 |
| 2001 | 1.148 | 1.122 | 1.132 | 1.132 | 1.182 | 1.234 | 1.173 | 1.110 | 1.281 | 1.232 | 1.056 | 0.855 |
| 2002 | 0.817 | 0.792 | 0.867 | 1.033 | 1.031 | 1.058 | 1.069 | 1.066 | 1.027 | 0.994 | 1.010 | 0.979 |
| 2003 | 1.038 | 1.308 | 1.481 | 1.371 | 1.224 | 1.214 | 1.208 | 1.391 | 1.456 | 1.279 | 1.211 | 1.146 |
| 2004 | 1.253 | 1.333 | 1.413 | 1.535 | 1.820 | 1.760 | 1.535 | 1.498 | 1.552 | 1.618 | 1.600 | 1.445 |
| 2005 | 1.374 | 1.515 | 1.722 | 2.001 | 1.973 | 1.821 | 1.941 | 2.141 | 2.355 | 2.211 | 1.931 | 1.695 |
| 2006 | 1.725 | 1.699 | 1.928 | 2.296 | 2.641 | 2.579 | 2.511 | 2.549 | 2.346 | 2.069 | 2.073 | NA |
| 2007 | 2.204 | 2.034 | 2.370 | 2.665 | 2.955 | 2.692 | 2.476 | 2.313 | 2.398 | 2.509 | 2.715 | 2.624 |
| 2008 | 2.600 | 2.655 | 3.003 | 3.063 | 3.378 | 3.765 | 3.777 | 3.448 | 3.210 | 2.727 | 1.758 | 1.330 |
| 2009 | 1.481 | 1.618 | 1.616 | 1.727 | 1.933 | 2.280 | 2.218 | 2.304 | 2.388 | 2.263 | 2.293 | 2.252 |
| 2010 | 2.318 | 2.276 | 2.405 | 2.475 | 2.444 | 2.358 | 2.427 | 2.519 | 2.462 | 2.481 | 2.531 | 2.598 |
| 2011 | 2.676 | 2.766 | 3.118 | 3.319 | 3.397 | 3.279 | 3.204 | 3.206 | 3.297 | 3.224 | 3.118 | 2.871 |
| 2012 | 2.890 | 3.093 | 3.465 | 3.506 | 3.598 | 3.370 | 2.998 | 3.324 | 3.452 | 3.438 | 2.994 | 2.757 |
| 2013 | 2.785 | 3.071 | 3.228 | 3.075 | 3.318 | 3.283 | 3.302 | 3.254 | 3.179 | 2.996 | 2.760 | 2.761 |
| 2014 | 2.764 | 2.772 | 3.022 | 3.235 | 3.339 | 3.401 | 3.439 | 3.352 | 3.243 | 2.814 | 2.416 | 2.179 |
| 2015 | 1.678 | 1.822 | 2.323 | 2.188 | 2.460 | 2.544 | 2.587 | 2.454 | 2.218 | NA | 1.888 | 1.874 |
| 2016 | 1.771 | 1.418 | 1.640 | 1.785 | 2.032 | 2.092 | 2.114 | 1.994 | 2.077 | 2.113 | 2.028 | 1.977 |
| 2017 | 2.106 | 2.122 | 2.272 | 2.362 | 2.332 | 2.278 | 2.219 | 2.327 | 2.462 | 2.293 | 2.364 | 2.337 |
| 2018 | 2.328 | 2.435 | 2.508 | 2.650 | 2.785 | 2.806 | 2.762 | 2.735 | 2.718 | 2.825 | 2.741 | 2.526 |
| 2019 | 2.337 | 2.249 | 2.369 | 2.815 | 2.943 | 2.807 | 2.663 | 2.563 | 2.541 | 2.731 | 2.775 | 2.552 |
| 2020 | 2.432 | 2.437 | 2.400 | 2.096 | 1.990 | 2.086 | 2.167 | 2.188 | 2.182 | 2.156 | 2.147 | 2.145 |
| 2021 | 2.199 | 2.313 | 2.603 | 2.738 | 2.916 | W | W | W | W | W | W | W |
| 2022 | W | W | W | |||||||||
| - = No Data Reported; -- = Not Applicable; NA = Not Available; W = Withheld to avoid disclosure of individual company data. |
| Release Date: 6/1/2022 |
| Next Release Date: TBD |