|
Download Data (XLS File) |
|
||||||||
|
||||||||
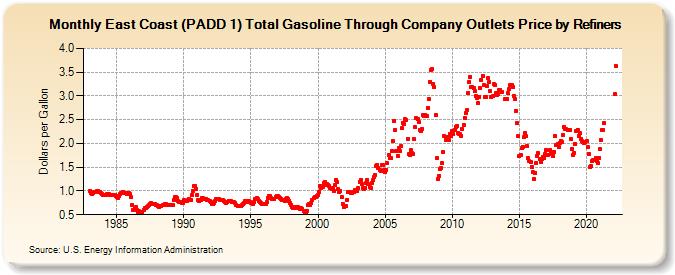
| East Coast (PADD 1) Total Gasoline Through Company Outlets Price by Refiners (Dollars per Gallon) | ||||||||
| Year | Jan | Feb | Mar | Apr | May | Jun | Jul | Aug | Sep | Oct | Nov | Dec |
|---|---|---|---|---|---|---|---|---|---|---|---|---|
| 1983 | 0.995 | 0.957 | 0.933 | 0.961 | 0.980 | 0.984 | 0.993 | 0.993 | 0.984 | 0.968 | 0.955 | 0.937 |
| 1984 | 0.921 | 0.916 | 0.916 | 0.927 | 0.931 | 0.931 | 0.920 | 0.908 | 0.909 | 0.909 | 0.905 | 0.894 |
| 1985 | 0.872 | 0.861 | 0.891 | 0.933 | 0.952 | 0.962 | 0.968 | 0.964 | 0.951 | 0.945 | 0.947 | 0.953 |
| 1986 | 0.933 | 0.865 | 0.707 | 0.605 | 0.632 | 0.652 | 0.603 | 0.562 | 0.571 | 0.550 | 0.549 | 0.557 |
| 1987 | 0.608 | 0.640 | 0.646 | 0.664 | 0.675 | 0.695 | 0.716 | 0.736 | 0.734 | 0.730 | 0.724 | 0.714 |
| 1988 | 0.695 | 0.673 | 0.660 | 0.675 | 0.692 | 0.697 | 0.711 | 0.727 | 0.719 | 0.710 | 0.707 | 0.706 |
| 1989 | 0.704 | 0.703 | 0.711 | 0.813 | 0.868 | 0.866 | 0.848 | 0.799 | 0.771 | 0.768 | 0.754 | 0.752 |
| 1990 | 0.815 | 0.799 | 0.785 | 0.793 | 0.805 | 0.822 | 0.816 | 0.912 | 1.005 | 1.098 | 1.102 | 1.036 |
| 1991 | 0.914 | 0.820 | 0.779 | 0.804 | 0.847 | 0.846 | 0.823 | 0.831 | 0.834 | 0.800 | 0.805 | 0.784 |
| 1992 | 0.766 | 0.735 | 0.724 | 0.743 | 0.789 | 0.833 | 0.837 | 0.825 | 0.816 | 0.813 | 0.818 | 0.804 |
| 1993 | 0.779 | 0.764 | 0.757 | 0.770 | 0.789 | 0.797 | 0.787 | 0.772 | 0.758 | 0.758 | 0.736 | 0.702 |
| 1994 | 0.673 | 0.679 | 0.676 | 0.688 | 0.697 | 0.722 | 0.752 | 0.794 | 0.794 | 0.776 | 0.783 | 0.776 |
| 1995 | 0.755 | 0.740 | 0.730 | 0.761 | 0.838 | 0.855 | 0.830 | 0.791 | 0.767 | 0.745 | 0.715 | 0.715 |
| 1996 | 0.732 | 0.734 | 0.767 | 0.854 | 0.901 | 0.889 | 0.860 | 0.834 | 0.826 | 0.835 | 0.872 | 0.891 |
| 1997 | 0.889 | 0.877 | 0.847 | 0.827 | 0.814 | 0.813 | 0.795 | 0.840 | 0.857 | 0.823 | 0.789 | 0.754 |
| 1998 | 0.712 | 0.668 | 0.634 | 0.646 | 0.661 | 0.664 | 0.655 | 0.632 | 0.616 | 0.635 | 0.623 | 0.585 |
| 1999 | 0.564 | 0.545 | 0.583 | 0.696 | 0.718 | 0.710 | 0.748 | 0.811 | 0.850 | 0.864 | 0.868 | 0.901 |
| 2000 | 0.911 | 0.970 | 1.112 | 1.072 | 1.076 | 1.159 | 1.198 | 1.128 | 1.148 | 1.133 | 1.103 | 1.053 |
| 2001 | 1.047 | 1.053 | 1.007 | 1.120 | 1.239 | 1.186 | 1.032 | 0.980 | 1.004 | 0.867 | 0.730 | 0.660 |
| 2002 | 0.685 | 0.687 | 0.818 | 0.984 | 0.979 | 0.956 | 0.960 | 0.975 | 0.979 | 1.025 | 1.020 | 0.998 |
| 2003 | 1.055 | 1.189 | 1.232 | 1.152 | 1.053 | 1.036 | 1.064 | 1.171 | 1.232 | 1.138 | 1.086 | 1.064 |
| 2004 | 1.163 | 1.220 | 1.292 | 1.332 | 1.515 | 1.553 | 1.481 | 1.444 | 1.430 | 1.547 | 1.540 | 1.440 |
| 2005 | 1.400 | 1.450 | 1.580 | 1.751 | 1.697 | 1.695 | 1.834 | 2.046 | 2.477 | 2.287 | 1.836 | 1.741 |
| 2006 | 1.905 | 1.844 | 1.937 | 2.315 | 2.431 | 2.408 | 2.506 | 2.489 | 2.103 | 1.768 | 1.760 | 1.864 |
| 2007 | 1.798 | 1.775 | 2.090 | 2.337 | 2.537 | 2.514 | 2.449 | 2.284 | 2.271 | 2.312 | 2.594 | 2.581 |
| 2008 | 2.604 | 2.585 | 2.756 | 2.940 | 3.301 | 3.548 | 3.558 | 3.260 | 3.192 | 2.595 | 1.686 | 1.255 |
| 2009 | 1.317 | 1.467 | 1.493 | 1.583 | 1.816 | 2.146 | 2.071 | 2.140 | 2.065 | 2.065 | 2.194 | 2.165 |
| 2010 | 2.260 | 2.195 | 2.292 | 2.356 | 2.370 | 2.216 | 2.199 | 2.207 | 2.161 | 2.299 | 2.394 | 2.543 |
| 2011 | 2.642 | 2.712 | 3.054 | 3.296 | 3.408 | 3.189 | 3.190 | 3.163 | 3.093 | 2.994 | 2.948 | 2.842 |
| 2012 | 2.974 | 3.165 | 3.337 | 3.429 | 3.228 | 2.972 | 2.971 | 3.219 | 3.376 | 3.297 | 3.093 | 2.975 |
| 2013 | 2.990 | 3.243 | 3.232 | 3.064 | 3.027 | 3.040 | 3.126 | 3.128 | 3.078 | NA | NA | 2.931 |
| 2014 | 2.925 | 2.943 | 3.055 | 3.143 | 3.222 | 3.223 | 3.183 | 3.006 | 2.932 | 2.693 | 2.429 | 2.148 |
| 2015 | 1.726 | 1.767 | 1.902 | 1.935 | 2.129 | 2.226 | 2.151 | 1.938 | 1.686 | 1.623 | 1.600 | 1.510 |
| 2016 | 1.395 | 1.252 | 1.384 | 1.592 | 1.744 | 1.792 | 1.681 | 1.617 | 1.663 | 1.718 | 1.685 | 1.780 |
| 2017 | 1.852 | 1.764 | 1.751 | 1.862 | 1.827 | 1.774 | 1.732 | 1.815 | 2.148 | 1.961 | 1.990 | 1.930 |
| 2018 | 2.017 | 2.058 | 2.023 | 2.181 | 2.343 | 2.314 | 2.294 | 2.287 | 2.282 | 2.277 | 2.100 | 1.881 |
| 2019 | 1.767 | 1.801 | 1.983 | 2.263 | 2.288 | 2.162 | 2.211 | 2.103 | 2.051 | 2.029 | 2.016 | 2.024 |
| 2020 | 2.045 | 1.934 | 1.786 | 1.509 | 1.524 | 1.625 | 1.651 | 1.646 | 1.685 | 1.634 | 1.588 | 1.699 |
| 2021 | 1.875 | 2.071 | 2.293 | 2.281 | 2.433 | W | W | W | W | W | W | W |
| 2022 | NA | 3.034 | 3.630 | |||||||||
| - = No Data Reported; -- = Not Applicable; NA = Not Available; W = Withheld to avoid disclosure of individual company data. |
| Release Date: 6/1/2022 |
| Next Release Date: TBD |