|
Download Data (XLS File) |
|
||||||||
|
||||||||
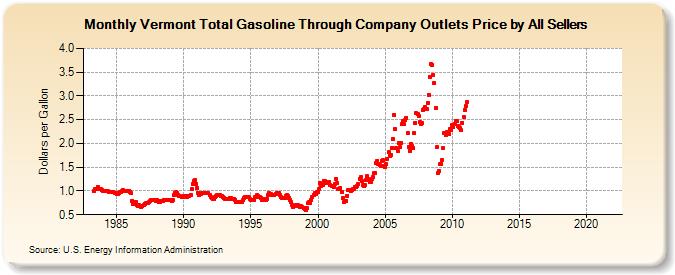
| Vermont Total Gasoline Through Company Outlets Price by All Sellers (Dollars per Gallon) | ||||||||
| Year | Jan | Feb | Mar | Apr | May | Jun | Jul | Aug | Sep | Oct | Nov | Dec |
|---|---|---|---|---|---|---|---|---|---|---|---|---|
| 1983 | W | W | W | W | 1.001 | 1.031 | 1.045 | 1.093 | 1.046 | 1.045 | 1.038 | 1.016 |
| 1984 | 0.991 | 0.992 | 0.991 | 0.993 | 0.991 | 0.983 | 0.979 | 0.975 | 0.973 | 0.975 | 0.966 | 0.956 |
| 1985 | 0.930 | 0.937 | 0.955 | 0.970 | 0.980 | 0.992 | 1.010 | 1.005 | 1.006 | 0.995 | 0.999 | 1.006 |
| 1986 | 0.988 | 0.951 | 0.798 | 0.721 | 0.774 | 0.778 | 0.701 | 0.687 | 0.694 | 0.686 | 0.664 | 0.679 |
| 1987 | 0.711 | 0.734 | 0.738 | 0.738 | 0.738 | 0.770 | 0.793 | 0.817 | 0.810 | 0.811 | 0.815 | 0.797 |
| 1988 | 0.801 | 0.786 | 0.775 | 0.773 | 0.781 | 0.788 | 0.806 | 0.812 | 0.806 | 0.802 | 0.809 | 0.803 |
| 1989 | 0.807 | 0.798 | 0.806 | 0.909 | 0.963 | 0.969 | 0.952 | 0.921 | 0.897 | 0.893 | 0.878 | 0.866 |
| 1990 | 0.900 | 0.898 | 0.888 | 0.874 | 0.890 | 0.904 | 0.912 | 1.035 | 1.150 | 1.213 | 1.226 | 1.151 |
| 1991 | 1.055 | 0.965 | 0.916 | 0.935 | 0.959 | 0.965 | 0.954 | 0.965 | 0.965 | 0.947 | 0.949 | 0.924 |
| 1992 | 0.882 | 0.857 | 0.836 | 0.839 | 0.867 | 0.897 | 0.917 | 0.914 | 0.907 | 0.904 | 0.894 | 0.873 |
| 1993 | 0.858 | 0.839 | 0.827 | 0.825 | 0.838 | 0.852 | 0.848 | 0.834 | 0.830 | 0.834 | 0.814 | 0.778 |
| 1994 | 0.761 | 0.764 | 0.762 | 0.762 | 0.778 | 0.803 | 0.848 | 0.868 | 0.872 | 0.872 | 0.871 | 0.822 |
| 1995 | 0.814 | 0.811 | 0.800 | 0.809 | 0.868 | 0.907 | 0.889 | 0.875 | 0.870 | 0.856 | 0.815 | 0.823 |
| 1996 | 0.825 | 0.813 | 0.827 | 0.912 | 0.956 | 0.942 | 0.934 | 0.922 | 0.920 | 0.922 | 0.939 | 0.965 |
| 1997 | 0.957 | 0.953 | 0.911 | 0.875 | 0.860 | 0.854 | 0.843 | 0.900 | 0.914 | 0.895 | 0.862 | 0.812 |
| 1998 | 0.763 | 0.712 | 0.671 | 0.682 | 0.703 | 0.705 | 0.695 | 0.675 | 0.659 | 0.676 | 0.660 | 0.631 |
| 1999 | 0.621 | 0.596 | 0.636 | 0.741 | 0.759 | 0.752 | 0.810 | 0.877 | 0.917 | 0.947 | 0.945 | 0.971 |
| 2000 | 0.988 | 1.037 | 1.163 | 1.104 | 1.125 | 1.219 | 1.211 | 1.169 | 1.193 | 1.198 | 1.191 | 1.122 |
| 2001 | 1.110 | 1.110 | 1.075 | 1.149 | 1.255 | 1.172 | 1.048 | 1.033 | 1.058 | 0.972 | 0.851 | 0.765 |
| 2002 | 0.788 | 0.796 | 0.904 | 1.020 | 1.023 | 1.002 | 1.017 | 1.042 | 1.050 | 1.083 | 1.087 | 1.105 |
| 2003 | 1.147 | 1.260 | 1.284 | 1.205 | 1.128 | 1.104 | 1.124 | 1.237 | 1.305 | 1.247 | 1.186 | 1.180 |
| 2004 | 1.254 | 1.302 | 1.368 | 1.378 | 1.595 | 1.629 | 1.575 | 1.544 | 1.523 | 1.638 | 1.641 | 1.528 |
| 2005 | 1.509 | 1.559 | 1.673 | 1.810 | 1.741 | 1.763 | 1.905 | 2.093 | 2.605 | 2.295 | 1.898 | 1.851 |
| 2006 | 2.012 | 1.917 | 2.013 | 2.402 | 2.473 | 2.406 | 2.487 | 2.541 | 2.230 | 1.922 | 1.851 | 1.992 |
| 2007 | 1.944 | 1.907 | 2.217 | 2.434 | 2.631 | 2.623 | 2.580 | 2.454 | 2.417 | 2.438 | 2.706 | 2.723 |
| 2008 | 2.760 | 2.731 | 2.855 | 3.028 | 3.404 | 3.667 | 3.657 | 3.443 | 3.274 | 2.752 | 1.915 | 1.376 |
| 2009 | 1.413 | 1.559 | 1.576 | 1.655 | 1.894 | 2.212 | 2.184 | 2.235 | 2.212 | 2.197 | 2.299 | 2.278 |
| 2010 | 2.379 | 2.342 | 2.406 | 2.482 | 2.474 | 2.366 | 2.336 | 2.323 | 2.276 | 2.430 | 2.551 | 2.710 |
| 2011 | 2.787 | 2.864 | - | - | - | - | - | - | - | - | - | - |
| 2012 | - | - | - | - | - | - | - | - | - | - | - | - |
| 2013 | - | - | - | - | - | - | - | - | - | - | - | - |
| 2014 | - | - | - | - | - | - | - | - | - | - | - | - |
| 2015 | - | - | - | - | - | - | - | - | - | - | - | - |
| 2016 | - | - | - | - | - | - | - | - | - | - | - | - |
| 2017 | - | - | - | - | - | - | - | - | - | - | - | - |
| 2018 | - | - | - | - | - | - | - | - | - | - | - | - |
| 2019 | - | - | - | - | - | - | - | - | - | - | - | - |
| 2020 | - | - | - | - | - | - | - | - | - | - | - | - |
| 2021 | - | - | - | - | - | - | - | - | - | - | - | - |
| 2022 | - | - | - | |||||||||
| - = No Data Reported; -- = Not Applicable; NA = Not Available; W = Withheld to avoid disclosure of individual company data. |
| Release Date: 6/1/2022 |
| Next Release Date: TBD |