|
Download Data (XLS File) |
|
||||||||
|
||||||||
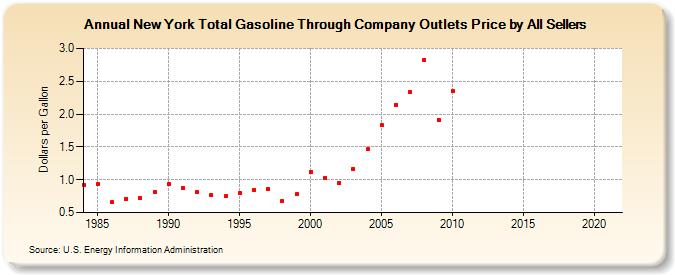
| New York Total Gasoline Through Company Outlets Price by All Sellers (Dollars per Gallon) | ||||||||
| Decade | Year-0 | Year-1 | Year-2 | Year-3 | Year-4 | Year-5 | Year-6 | Year-7 | Year-8 | Year-9 |
|---|---|---|---|---|---|---|---|---|---|---|
| 1980's | 0.923 | 0.937 | 0.660 | 0.713 | 0.726 | 0.819 | ||||
| 1990's | 0.936 | 0.873 | 0.806 | 0.768 | 0.748 | 0.795 | 0.851 | 0.855 | 0.669 | 0.777 |
| 2000's | 1.125 | 1.028 | 0.951 | 1.166 | 1.464 | 1.828 | 2.144 | 2.337 | 2.828 | 1.917 |
| 2010's | 2.345 | - | - | - | - | - | - | - | - | - |
| 2020's | - |
| - = No Data Reported; -- = Not Applicable; NA = Not Available; W = Withheld to avoid disclosure of individual company data. |
| Release Date: 6/1/2022 |
| Next Release Date: TBD |