|
Download Data (XLS File) |
|
||||||||
|
||||||||
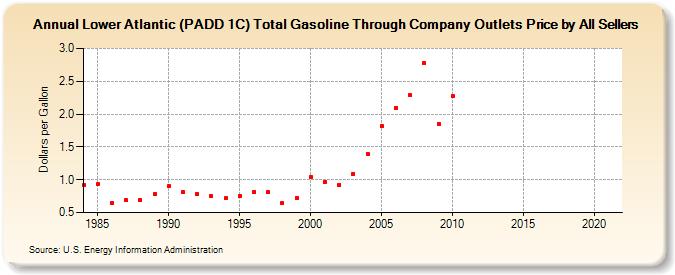
| Lower Atlantic (PADD 1C) Total Gasoline Through Company Outlets Price by All Sellers (Dollars per Gallon) | ||||||||
| Decade | Year-0 | Year-1 | Year-2 | Year-3 | Year-4 | Year-5 | Year-6 | Year-7 | Year-8 | Year-9 |
|---|---|---|---|---|---|---|---|---|---|---|
| 1980's | 0.913 | 0.928 | 0.642 | 0.687 | 0.693 | 0.778 | ||||
| 1990's | 0.903 | 0.812 | 0.778 | 0.747 | 0.716 | 0.752 | 0.819 | 0.807 | 0.638 | 0.724 |
| 2000's | 1.047 | 0.964 | 0.920 | 1.094 | 1.393 | 1.820 | 2.093 | 2.289 | 2.770 | 1.852 |
| 2010's | 2.272 | - | - | - | - | - | - | - | - | - |
| 2020's | - |
| - = No Data Reported; -- = Not Applicable; NA = Not Available; W = Withheld to avoid disclosure of individual company data. |
| Release Date: 6/1/2022 |
| Next Release Date: TBD |