|
Download Data (XLS File) |
|
||||||||
|
||||||||
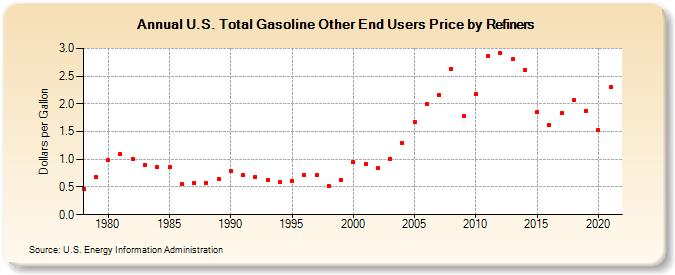
| U.S. Total Gasoline Other End Users Price by Refiners (Dollars per Gallon) | ||||||||
| Decade | Year-0 | Year-1 | Year-2 | Year-3 | Year-4 | Year-5 | Year-6 | Year-7 | Year-8 | Year-9 |
|---|---|---|---|---|---|---|---|---|---|---|
| 1970's | 0.461 | 0.679 | ||||||||
| 1980's | 0.985 | 1.092 | 1.010 | 0.905 | 0.856 | 0.852 | 0.558 | 0.575 | 0.564 | 0.652 |
| 1990's | 0.797 | 0.713 | 0.681 | 0.629 | 0.585 | 0.613 | 0.716 | 0.717 | 0.522 | 0.630 |
| 2000's | 0.953 | 0.907 | 0.836 | 1.006 | 1.295 | 1.679 | 1.998 | 2.159 | 2.636 | 1.779 |
| 2010's | 2.174 | 2.858 | 2.916 | 2.800 | 2.610 | 1.847 | 1.618 | 1.831 | 2.078 | 1.878 |
| 2020's | 1.523 |
| - = No Data Reported; -- = Not Applicable; NA = Not Available; W = Withheld to avoid disclosure of individual company data. |
| Release Date: 6/1/2022 |
| Next Release Date: TBD |