|
Download Data (XLS File) |
|
||||||||
|
||||||||
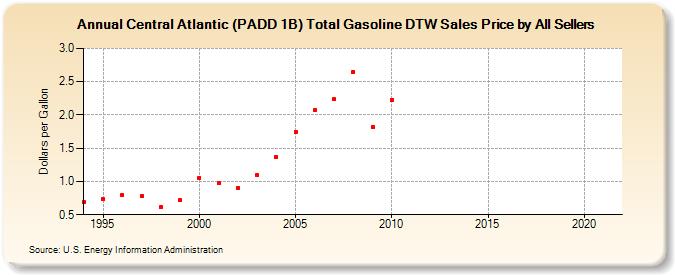
| Central Atlantic (PADD 1B) Total Gasoline DTW Sales Price by All Sellers (Dollars per Gallon) | ||||||||
| Decade | Year-0 | Year-1 | Year-2 | Year-3 | Year-4 | Year-5 | Year-6 | Year-7 | Year-8 | Year-9 |
|---|---|---|---|---|---|---|---|---|---|---|
| 1990's | 0.686 | 0.734 | 0.797 | 0.788 | 0.613 | 0.716 | ||||
| 2000's | 1.058 | 0.977 | 0.906 | 1.096 | 1.370 | 1.749 | 2.067 | 2.235 | 2.647 | 1.817 |
| 2010's | 2.231 | - | - | - | - | - | - | - | - | - |
| 2020's | - |
| - = No Data Reported; -- = Not Applicable; NA = Not Available; W = Withheld to avoid disclosure of individual company data. |
| Release Date: 6/1/2022 |
| Next Release Date: TBD |