|
Download Data (XLS File) |
|
||||||||
|
||||||||
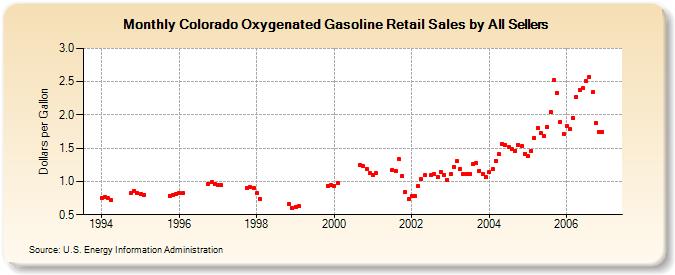
| Colorado Oxygenated Gasoline Retail Sales by All Sellers (Dollars per Gallon) | ||||||||
| Year | Jan | Feb | Mar | Apr | May | Jun | Jul | Aug | Sep | Oct | Nov | Dec |
|---|---|---|---|---|---|---|---|---|---|---|---|---|
| 1994 | 0.757 | 0.771 | 0.746 | 0.721 | W | W | W | W | W | 0.823 | 0.861 | 0.828 |
| 1995 | 0.818 | 0.801 | W | W | NA | W | W | W | W | 0.783 | 0.794 | 0.814 |
| 1996 | 0.824 | 0.823 | NA | W | - | - | - | - | W | 0.963 | 0.986 | 0.960 |
| 1997 | 0.951 | 0.943 | W | W | W | W | W | W | W | 0.909 | 0.911 | 0.898 |
| 1998 | 0.825 | 0.732 | - | - | - | - | - | - | - | NA | 0.658 | 0.598 |
| 1999 | 0.620 | 0.628 | NA | W | W | W | - | - | - | W | 0.936 | 0.940 |
| 2000 | 0.932 | 0.975 | W | W | W | W | W | W | 1.252 | 1.225 | 1.190 | 1.125 |
| 2001 | 1.100 | 1.124 | NA | NA | NA | NA | 1.173 | 1.158 | 1.332 | 1.084 | 0.843 | 0.735 |
| 2002 | 0.779 | 0.777 | 0.932 | 1.033 | 1.091 | NA | 1.091 | 1.109 | 1.073 | 1.149 | 1.098 | 1.027 |
| 2003 | 1.109 | 1.217 | 1.300 | 1.192 | 1.113 | 1.111 | 1.118 | 1.257 | 1.279 | 1.161 | 1.109 | 1.064 |
| 2004 | 1.138 | 1.183 | 1.312 | 1.406 | 1.568 | 1.553 | 1.513 | 1.487 | 1.465 | 1.554 | 1.527 | 1.420 |
| 2005 | 1.377 | 1.459 | 1.659 | 1.805 | 1.726 | 1.679 | 1.816 | 2.042 | 2.521 | 2.334 | 1.898 | 1.719 |
| 2006 | 1.834 | 1.786 | 1.957 | 2.276 | 2.377 | 2.399 | 2.509 | 2.572 | 2.339 | 1.881 | 1.744 | 1.741 |
| - = No Data Reported; -- = Not Applicable; NA = Not Available; W = Withheld to avoid disclosure of individual company data. |
| Release Date: 6/1/2022 |
| Next Release Date: TBD |