|
Download Data (XLS File) |
|
||||||||
|
||||||||
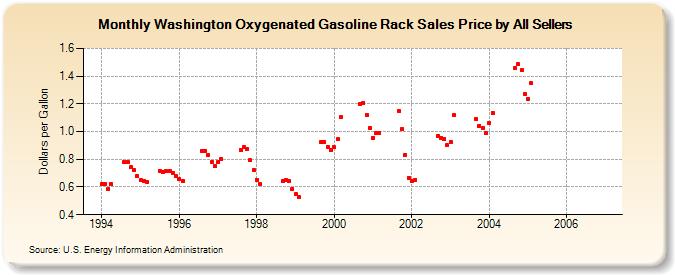
| Washington Oxygenated Gasoline Rack Sales Price by All Sellers (Dollars per Gallon) | ||||||||
| Year | Jan | Feb | Mar | Apr | May | Jun | Jul | Aug | Sep | Oct | Nov | Dec |
|---|---|---|---|---|---|---|---|---|---|---|---|---|
| 1994 | 0.619 | 0.624 | 0.585 | 0.621 | - | W | W | 0.780 | 0.781 | 0.743 | 0.722 | 0.676 |
| 1995 | 0.650 | 0.646 | 0.637 | W | W | NA | 0.718 | 0.705 | 0.715 | 0.716 | 0.703 | 0.677 |
| 1996 | 0.657 | 0.642 | W | W | W | W | W | 0.862 | 0.861 | 0.832 | 0.780 | 0.748 |
| 1997 | 0.778 | 0.801 | W | W | W | W | W | 0.869 | 0.886 | 0.871 | 0.792 | 0.722 |
| 1998 | 0.654 | 0.622 | W | W | W | W | W | W | 0.643 | 0.650 | 0.640 | 0.586 |
| 1999 | 0.548 | 0.526 | W | W | W | W | W | W | 0.924 | 0.924 | 0.890 | 0.864 |
| 2000 | 0.886 | 0.943 | 1.102 | W | W | W | W | W | 1.199 | 1.206 | 1.122 | 1.027 |
| 2001 | 0.957 | 0.993 | 0.992 | W | W | W | W | W | 1.149 | 1.018 | 0.833 | 0.666 |
| 2002 | 0.642 | 0.653 | W | W | W | W | W | W | 0.969 | 0.957 | 0.949 | 0.901 |
| 2003 | 0.926 | 1.118 | W | W | W | W | W | W | 1.087 | 1.042 | 1.025 | 0.986 |
| 2004 | 1.059 | 1.135 | W | W | NA | NA | NA | NA | 1.460 | 1.484 | 1.444 | 1.269 |
| 2005 | 1.237 | 1.350 | - | - | - | - | - | - | - | - | - | - |
| 2006 | - | - | - | - | - | - | - | - | - | - | - | - |
| - = No Data Reported; -- = Not Applicable; NA = Not Available; W = Withheld to avoid disclosure of individual company data. |
| Release Date: 6/1/2022 |
| Next Release Date: TBD |