|
Download Data (XLS File) |
|
||||||||
|
||||||||
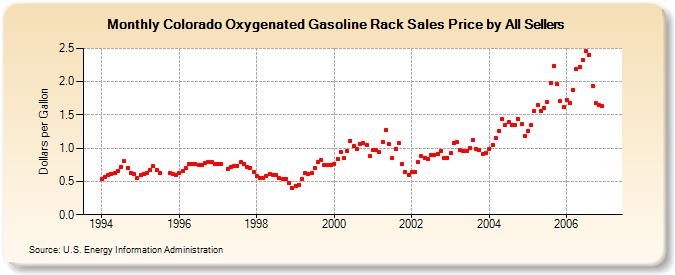
| Colorado Oxygenated Gasoline Rack Sales Price by All Sellers (Dollars per Gallon) | ||||||||
| Year | Jan | Feb | Mar | Apr | May | Jun | Jul | Aug | Sep | Oct | Nov | Dec |
|---|---|---|---|---|---|---|---|---|---|---|---|---|
| 1994 | 0.533 | 0.569 | 0.595 | 0.615 | 0.625 | 0.660 | 0.720 | 0.808 | 0.709 | 0.632 | 0.613 | 0.550 |
| 1995 | 0.595 | 0.618 | 0.630 | 0.672 | 0.725 | 0.676 | 0.626 | NA | W | 0.620 | 0.608 | 0.599 |
| 1996 | 0.630 | 0.652 | 0.699 | 0.765 | 0.758 | 0.762 | 0.740 | 0.751 | 0.777 | 0.789 | 0.797 | 0.762 |
| 1997 | 0.765 | 0.767 | NA | 0.689 | 0.723 | 0.725 | 0.738 | 0.787 | 0.758 | 0.722 | 0.706 | 0.641 |
| 1998 | 0.576 | 0.548 | 0.555 | 0.584 | 0.619 | 0.604 | 0.591 | 0.550 | 0.530 | 0.534 | 0.478 | 0.403 |
| 1999 | 0.434 | 0.448 | 0.538 | 0.622 | 0.618 | 0.623 | 0.704 | 0.797 | 0.816 | 0.751 | 0.750 | 0.752 |
| 2000 | 0.767 | 0.843 | 0.949 | 0.845 | 0.962 | 1.115 | 1.032 | 0.984 | 1.059 | 1.077 | 1.045 | 0.887 |
| 2001 | 0.969 | 0.972 | 0.936 | 1.099 | 1.274 | 1.059 | 0.848 | 0.993 | 1.073 | 0.764 | 0.648 | 0.603 |
| 2002 | 0.637 | 0.642 | 0.785 | 0.877 | 0.853 | 0.841 | 0.899 | 0.900 | 0.918 | 0.963 | 0.845 | 0.855 |
| 2003 | 0.921 | 1.078 | 1.089 | 0.971 | 0.964 | 0.951 | 1.008 | 1.125 | 0.990 | 0.973 | 0.917 | 0.921 |
| 2004 | 0.993 | 1.044 | 1.158 | 1.265 | 1.442 | 1.353 | 1.387 | 1.341 | 1.355 | 1.435 | 1.361 | 1.190 |
| 2005 | 1.255 | 1.344 | 1.557 | 1.649 | 1.561 | 1.610 | 1.687 | 1.975 | 2.232 | 1.965 | 1.709 | 1.614 |
| 2006 | 1.721 | 1.680 | 1.880 | 2.188 | 2.225 | 2.322 | 2.455 | 2.406 | 1.940 | 1.672 | 1.644 | 1.635 |
| - = No Data Reported; -- = Not Applicable; NA = Not Available; W = Withheld to avoid disclosure of individual company data. |
| Release Date: 6/1/2022 |
| Next Release Date: TBD |