|
Download Data (XLS File) |
|
||||||||
|
||||||||
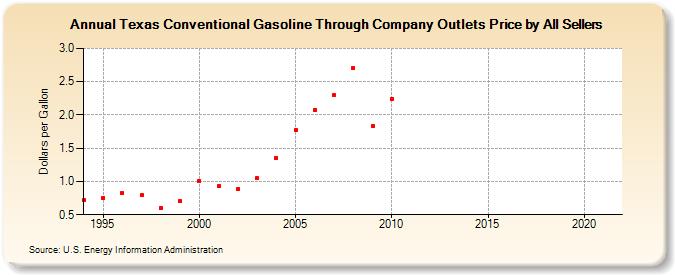
| Texas Conventional Gasoline Through Company Outlets Price by All Sellers (Dollars per Gallon) | ||||||||
| Decade | Year-0 | Year-1 | Year-2 | Year-3 | Year-4 | Year-5 | Year-6 | Year-7 | Year-8 | Year-9 |
|---|---|---|---|---|---|---|---|---|---|---|
| 1990's | 0.718 | 0.757 | 0.827 | 0.789 | 0.606 | 0.699 | ||||
| 2000's | 1.005 | 0.926 | 0.885 | 1.051 | 1.351 | 1.778 | 2.072 | 2.295 | 2.702 | 1.827 |
| 2010's | 2.240 | - | - | - | - | - | - | - | - | - |
| 2020's | - |
| - = No Data Reported; -- = Not Applicable; NA = Not Available; W = Withheld to avoid disclosure of individual company data. |
| Release Date: 6/1/2022 |
| Next Release Date: TBD |