|
Download Data (XLS File) |
|
||||||||
|
||||||||
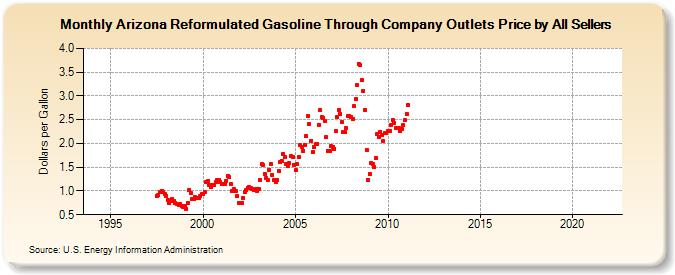
| Arizona Reformulated Gasoline Through Company Outlets Price by All Sellers (Dollars per Gallon) | ||||||||
| Year | Jan | Feb | Mar | Apr | May | Jun | Jul | Aug | Sep | Oct | Nov | Dec |
|---|---|---|---|---|---|---|---|---|---|---|---|---|
| 1994 | - | - | - | - | - | - | - | - | - | - | - | - |
| 1995 | - | - | - | - | - | - | - | - | - | - | - | - |
| 1996 | - | - | - | - | - | - | - | - | - | - | - | - |
| 1997 | - | - | - | - | - | W | 0.887 | 0.907 | 0.973 | 1.002 | 0.987 | 0.942 |
| 1998 | 0.894 | 0.810 | 0.745 | 0.780 | 0.832 | 0.794 | 0.749 | 0.722 | 0.713 | 0.722 | 0.682 | 0.654 |
| 1999 | 0.679 | 0.623 | 0.753 | 1.023 | 0.953 | 0.835 | 0.834 | 0.869 | 0.849 | 0.862 | 0.884 | 0.932 |
| 2000 | 0.934 | 0.980 | 1.185 | 1.199 | 1.119 | 1.093 | 1.134 | 1.132 | 1.192 | 1.221 | 1.241 | 1.198 |
| 2001 | 1.139 | 1.137 | 1.143 | 1.215 | 1.323 | 1.291 | 1.145 | 0.991 | 1.047 | 0.995 | 0.886 | 0.751 |
| 2002 | 0.749 | 0.738 | 0.860 | 0.968 | 1.021 | 1.067 | 1.079 | 1.053 | 1.035 | 1.028 | 1.043 | 1.006 |
| 2003 | 1.035 | 1.226 | 1.564 | 1.552 | 1.359 | 1.275 | 1.221 | 1.441 | 1.562 | 1.341 | 1.241 | 1.185 |
| 2004 | 1.235 | 1.423 | 1.613 | 1.639 | 1.783 | 1.717 | 1.574 | 1.531 | 1.581 | 1.726 | 1.714 | 1.542 |
| 2005 | 1.437 | 1.565 | 1.723 | 1.964 | 1.929 | 1.847 | 1.975 | 2.156 | 2.579 | 2.406 | 2.061 | 1.812 |
| 2006 | 1.923 | 1.981 | 1.995 | 2.389 | 2.699 | 2.553 | 2.544 | 2.482 | 2.126 | 1.846 | 1.838 | 1.950 |
| 2007 | 1.930 | 1.890 | 2.252 | 2.549 | 2.696 | 2.617 | 2.444 | 2.239 | 2.232 | 2.324 | 2.576 | 2.574 |
| 2008 | 2.555 | 2.506 | 2.779 | 2.938 | 3.220 | 3.678 | 3.643 | 3.326 | 3.105 | 2.704 | 1.867 | 1.240 |
| 2009 | 1.358 | 1.590 | 1.557 | 1.499 | 1.689 | 2.198 | 2.143 | 2.244 | 2.181 | 2.054 | 2.222 | 2.221 |
| 2010 | 2.267 | 2.265 | 2.394 | 2.501 | 2.431 | 2.315 | 2.318 | 2.329 | 2.260 | 2.303 | 2.380 | 2.483 |
| 2011 | 2.613 | 2.808 | - | - | - | - | - | - | - | - | - | - |
| 2012 | - | - | - | - | - | - | - | - | - | - | - | - |
| 2013 | - | - | - | - | - | - | - | - | - | - | - | - |
| 2014 | - | - | - | - | - | - | - | - | - | - | - | - |
| 2015 | - | - | - | - | - | - | - | - | - | - | - | - |
| 2016 | - | - | - | - | - | - | - | - | - | - | - | - |
| 2017 | - | - | - | - | - | - | - | - | - | - | - | - |
| 2018 | - | - | - | - | - | - | - | - | - | - | - | - |
| 2019 | - | - | - | - | - | - | - | - | - | - | - | - |
| 2020 | - | - | - | - | - | - | - | - | - | - | - | - |
| 2021 | - | - | - | - | - | - | - | - | - | - | - | - |
| 2022 | - | - | - | |||||||||
| - = No Data Reported; -- = Not Applicable; NA = Not Available; W = Withheld to avoid disclosure of individual company data. |
| Release Date: 6/1/2022 |
| Next Release Date: TBD |