|
Download Data (XLS File) |
|
||||||||
|
||||||||
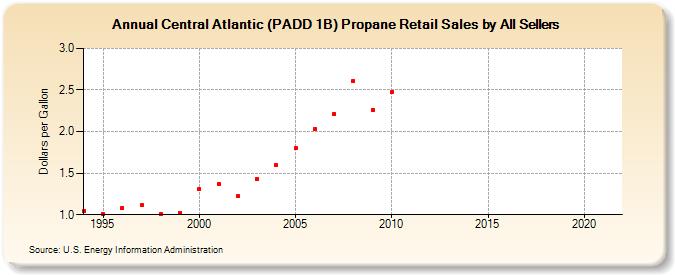
| Central Atlantic (PADD 1B) Propane Retail Sales by All Sellers (Dollars per Gallon) | ||||||||
| Decade | Year-0 | Year-1 | Year-2 | Year-3 | Year-4 | Year-5 | Year-6 | Year-7 | Year-8 | Year-9 |
|---|---|---|---|---|---|---|---|---|---|---|
| 1990's | 1.044 | 1.008 | 1.086 | 1.112 | 1.007 | 1.024 | ||||
| 2000's | 1.304 | 1.372 | 1.220 | 1.432 | 1.594 | 1.797 | 2.032 | 2.217 | 2.606 | 2.263 |
| 2010's | 2.480 | - | - | - | - | - | - | - | - | - |
| 2020's | - |
| - = No Data Reported; -- = Not Applicable; NA = Not Available; W = Withheld to avoid disclosure of individual company data. |
| Release Date: 6/1/2022 |
| Next Release Date: TBD |