|
Download Data (XLS File) |
|
||||||||
|
||||||||
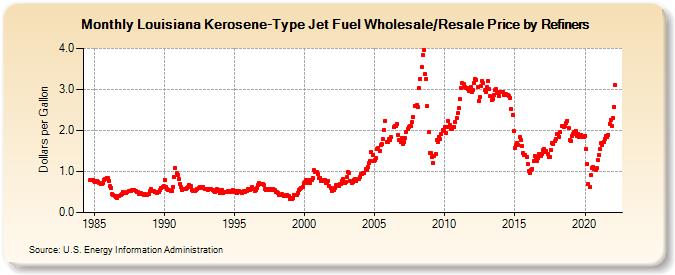
| Louisiana Kerosene-Type Jet Fuel Wholesale/Resale Price by Refiners (Dollars per Gallon) | ||||||||
| Year | Jan | Feb | Mar | Apr | May | Jun | Jul | Aug | Sep | Oct | Nov | Dec |
|---|---|---|---|---|---|---|---|---|---|---|---|---|
| 1984 | 0.785 | 0.795 | 0.803 | 0.769 | ||||||||
| 1985 | 0.753 | 0.766 | 0.769 | 0.755 | 0.726 | 0.704 | 0.699 | 0.715 | 0.801 | 0.806 | 0.851 | 0.830 |
| 1986 | 0.762 | 0.638 | 0.606 | 0.452 | 0.419 | 0.399 | 0.383 | 0.363 | 0.415 | 0.414 | 0.432 | 0.451 |
| 1987 | 0.513 | 0.472 | 0.471 | 0.475 | 0.490 | 0.522 | 0.533 | 0.534 | 0.538 | 0.558 | 0.556 | 0.526 |
| 1988 | 0.505 | 0.489 | 0.462 | 0.456 | 0.468 | 0.464 | 0.439 | 0.445 | 0.440 | 0.436 | 0.464 | 0.519 |
| 1989 | 0.563 | 0.530 | 0.530 | 0.524 | 0.501 | 0.488 | 0.512 | 0.506 | 0.557 | 0.594 | 0.611 | 0.636 |
| 1990 | 0.803 | 0.632 | 0.585 | 0.557 | 0.539 | 0.520 | 0.516 | 0.629 | 0.861 | 1.080 | 0.963 | 0.914 |
| 1991 | 0.822 | 0.706 | 0.623 | 0.561 | 0.563 | 0.564 | 0.575 | 0.605 | 0.625 | 0.669 | 0.650 | 0.558 |
| 1992 | 0.524 | 0.532 | 0.523 | 0.543 | 0.571 | 0.605 | 0.625 | 0.607 | 0.619 | 0.630 | 0.585 | 0.572 |
| 1993 | 0.567 | 0.560 | 0.571 | 0.565 | 0.565 | 0.542 | 0.522 | 0.504 | 0.523 | 0.566 | 0.559 | 0.487 |
| 1994 | 0.509 | 0.551 | 0.475 | 0.497 | 0.495 | 0.500 | 0.521 | 0.525 | 0.518 | 0.509 | 0.546 | 0.525 |
| 1995 | 0.511 | 0.520 | 0.477 | 0.501 | 0.519 | 0.490 | 0.472 | 0.501 | 0.523 | 0.508 | 0.531 | 0.562 |
| 1996 | 0.563 | 0.543 | 0.568 | 0.623 | 0.575 | 0.530 | 0.547 | 0.599 | 0.674 | 0.717 | 0.704 | 0.707 |
| 1997 | 0.707 | 0.673 | 0.566 | 0.558 | 0.567 | 0.539 | 0.557 | 0.577 | 0.551 | 0.585 | 0.558 | 0.500 |
| 1998 | 0.489 | 0.484 | 0.432 | 0.433 | 0.446 | 0.418 | 0.415 | 0.400 | 0.413 | 0.434 | 0.410 | 0.319 |
| 1999 | 0.343 | 0.330 | 0.352 | 0.420 | 0.428 | 0.426 | 0.488 | 0.554 | 0.575 | 0.607 | 0.627 | 0.711 |
| 2000 | 0.739 | 0.789 | 0.795 | 0.719 | 0.724 | 0.799 | 0.788 | 0.837 | 1.029 | 0.987 | 0.981 | 0.947 |
| 2001 | 0.839 | 0.841 | 0.761 | 0.764 | 0.790 | 0.793 | 0.732 | 0.739 | 0.773 | 0.644 | 0.591 | 0.517 |
| 2002 | 0.545 | 0.542 | 0.605 | 0.669 | 0.673 | 0.651 | 0.689 | 0.705 | 0.769 | 0.815 | 0.728 | 0.752 |
| 2003 | 0.867 | 0.999 | 0.967 | 0.763 | 0.718 | 0.739 | 0.785 | 0.816 | 0.776 | NA | 0.823 | 0.861 |
| 2004 | 0.946 | 0.940 | 0.956 | 0.959 | 1.057 | 1.034 | 1.100 | 1.214 | 1.266 | 1.487 | 1.397 | 1.258 |
| 2005 | 1.272 | 1.330 | 1.544 | 1.571 | 1.503 | 1.644 | 1.659 | 1.789 | 2.015 | 2.240 | 1.725 | 1.712 |
| 2006 | 1.789 | 1.777 | 1.835 | NA | 2.082 | 2.118 | 2.105 | 2.162 | 1.893 | 1.759 | 1.715 | 1.818 |
| 2007 | 1.672 | 1.718 | 1.808 | 1.974 | 2.031 | 2.085 | 2.117 | 2.105 | 2.206 | 2.326 | 2.601 | 2.605 |
| 2008 | 2.621 | 2.570 | 3.030 | 3.257 | 3.539 | 3.842 | 3.967 | 3.370 | 3.259 | 2.588 | 1.958 | 1.450 |
| 2009 | 1.451 | 1.344 | 1.199 | 1.390 | 1.424 | 1.762 | 1.725 | 1.851 | 1.798 | 1.906 | 2.020 | 1.980 |
| 2010 | 2.077 | 1.932 | 2.094 | 2.224 | 2.141 | 2.046 | 2.039 | 2.084 | 2.088 | 2.202 | 2.300 | 2.418 |
| 2011 | 2.541 | 2.759 | 3.046 | 3.145 | 3.121 | 3.051 | 3.037 | 3.038 | 3.002 | 2.964 | 3.053 | 2.934 |
| 2012 | 2.992 | 3.158 | 3.248 | 3.239 | 3.057 | 2.729 | 2.810 | 3.095 | 3.200 | 3.145 | 2.975 | 2.940 |
| 2013 | 3.054 | 3.206 | 3.007 | 2.835 | 2.735 | 2.761 | 2.863 | 2.980 | 3.009 | 2.903 | 2.831 | 2.935 |
| 2014 | 2.931 | 2.947 | 2.945 | 2.869 | 2.883 | 2.866 | 2.853 | 2.835 | 2.798 | 2.518 | 2.365 | 1.981 |
| 2015 | 1.569 | 1.655 | 1.695 | 1.654 | 1.839 | 1.767 | 1.617 | 1.441 | 1.405 | 1.410 | 1.350 | 1.181 |
| 2016 | 1.003 | 0.957 | 1.035 | 1.070 | 1.248 | 1.377 | 1.330 | 1.252 | 1.331 | 1.421 | 1.375 | 1.432 |
| 2017 | 1.517 | 1.549 | 1.482 | 1.500 | 1.429 | 1.358 | 1.355 | 1.527 | 1.698 | 1.664 | 1.739 | 1.798 |
| 2018 | 1.916 | 1.902 | 1.848 | 1.960 | 2.099 | 2.120 | 2.093 | 2.114 | 2.182 | 2.243 | 2.063 | 1.765 |
| 2019 | 1.754 | 1.875 | 1.912 | 1.968 | 1.995 | 1.877 | 1.912 | 1.851 | 1.873 | 1.882 | 1.850 | 1.844 |
| 2020 | 1.862 | 1.550 | 1.175 | 0.692 | 0.634 | 0.908 | 1.075 | 1.117 | 1.068 | 1.040 | 1.078 | 1.290 |
| 2021 | 1.399 | 1.537 | 1.684 | 1.637 | 1.729 | 1.801 | 1.872 | 1.847 | 1.896 | 2.169 | 2.265 | 2.105 |
| 2022 | 2.308 | 2.583 | 3.098 | |||||||||
| - = No Data Reported; -- = Not Applicable; NA = Not Available; W = Withheld to avoid disclosure of individual company data. |
| Release Date: 6/1/2022 |
| Next Release Date: TBD |