|
Download Data (XLS File) |
|
||||||||
|
||||||||
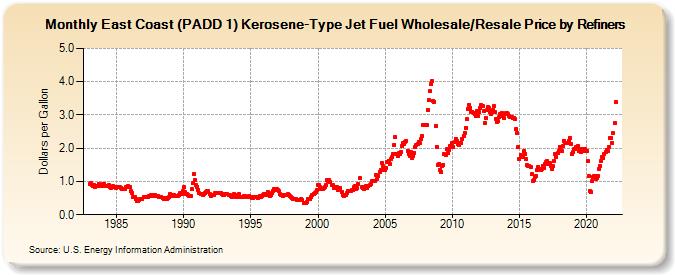
| East Coast (PADD 1) Kerosene-Type Jet Fuel Wholesale/Resale Price by Refiners (Dollars per Gallon) | ||||||||
| Year | Jan | Feb | Mar | Apr | May | Jun | Jul | Aug | Sep | Oct | Nov | Dec |
|---|---|---|---|---|---|---|---|---|---|---|---|---|
| 1983 | 0.934 | 0.953 | 0.890 | 0.853 | 0.888 | 0.839 | 0.875 | 0.875 | 0.913 | 0.904 | 0.879 | 0.855 |
| 1984 | 0.925 | 0.911 | 0.875 | 0.860 | 0.864 | 0.886 | 0.846 | 0.810 | 0.827 | 0.857 | 0.839 | 0.807 |
| 1985 | 0.823 | 0.825 | 0.819 | 0.832 | 0.810 | 0.781 | 0.774 | 0.787 | 0.828 | 0.842 | 0.860 | 0.846 |
| 1986 | 0.835 | 0.705 | 0.659 | 0.536 | 0.529 | 0.465 | 0.402 | 0.426 | 0.454 | 0.459 | 0.463 | 0.479 |
| 1987 | 0.529 | 0.524 | 0.527 | 0.527 | 0.540 | 0.552 | 0.573 | 0.578 | 0.548 | 0.592 | 0.600 | 0.554 |
| 1988 | 0.564 | 0.552 | 0.523 | 0.532 | 0.531 | 0.515 | 0.478 | 0.489 | 0.492 | 0.478 | 0.489 | 0.539 |
| 1989 | 0.611 | 0.576 | 0.580 | 0.606 | 0.569 | 0.559 | 0.552 | 0.563 | 0.594 | 0.650 | 0.634 | 0.699 |
| 1990 | 0.821 | 0.695 | 0.627 | 0.608 | 0.597 | 0.556 | 0.573 | 0.776 | 0.943 | 1.221 | 1.046 | 0.888 |
| 1991 | 0.841 | 0.757 | 0.638 | 0.614 | 0.614 | 0.601 | 0.617 | 0.658 | 0.676 | 0.710 | 0.719 | 0.621 |
| 1992 | 0.566 | 0.584 | 0.595 | 0.602 | 0.639 | 0.654 | 0.664 | 0.641 | 0.653 | 0.665 | 0.624 | 0.597 |
| 1993 | 0.595 | 0.610 | 0.624 | 0.609 | 0.605 | 0.585 | 0.548 | 0.543 | 0.570 | 0.611 | 0.593 | 0.521 |
| 1994 | 0.580 | 0.618 | 0.525 | 0.521 | 0.524 | 0.533 | 0.555 | 0.558 | 0.540 | 0.545 | 0.554 | 0.536 |
| 1995 | 0.521 | 0.511 | 0.490 | 0.526 | 0.547 | 0.534 | 0.507 | 0.532 | 0.555 | 0.543 | 0.562 | 0.587 |
| 1996 | 0.614 | 0.591 | 0.625 | 0.696 | 0.621 | 0.573 | 0.597 | 0.640 | 0.712 | 0.760 | 0.740 | 0.758 |
| 1997 | 0.737 | 0.700 | 0.609 | 0.597 | 0.585 | 0.566 | 0.578 | 0.604 | 0.591 | 0.615 | 0.606 | 0.550 |
| 1998 | 0.528 | 0.512 | 0.470 | 0.476 | 0.473 | 0.444 | 0.447 | 0.432 | 0.448 | 0.468 | 0.445 | 0.359 |
| 1999 | 0.366 | 0.346 | 0.397 | 0.466 | 0.462 | 0.469 | 0.534 | 0.585 | 0.637 | 0.640 | 0.674 | 0.737 |
| 2000 | 0.892 | 0.889 | 0.829 | 0.780 | 0.788 | 0.802 | 0.843 | 0.892 | 1.046 | 1.022 | 1.051 | 0.998 |
| 2001 | 0.898 | 0.879 | 0.807 | 0.804 | 0.845 | 0.823 | 0.754 | 0.772 | 0.803 | 0.685 | 0.604 | 0.556 |
| 2002 | 0.591 | 0.607 | 0.649 | 0.706 | 0.717 | 0.703 | 0.728 | 0.750 | 0.824 | 0.854 | 0.775 | 0.793 |
| 2003 | 0.926 | 1.095 | NA | 0.832 | 0.790 | 0.786 | 0.830 | 0.868 | 0.811 | 0.855 | 0.880 | 0.928 |
| 2004 | 1.003 | 1.027 | 1.015 | 1.024 | 1.187 | 1.088 | 1.171 | 1.272 | 1.357 | 1.568 | 1.452 | 1.340 |
| 2005 | 1.350 | 1.398 | 1.582 | 1.627 | 1.538 | 1.665 | 1.722 | 1.834 | 2.100 | 2.322 | 1.818 | 1.760 |
| 2006 | 1.843 | 1.820 | 1.896 | 2.066 | 2.147 | 2.124 | 2.197 | 2.221 | 1.925 | 1.820 | 1.778 | 1.887 |
| 2007 | 1.718 | 1.769 | 1.864 | 2.044 | 2.097 | 2.138 | 2.198 | 2.142 | 2.280 | 2.381 | 2.682 | 2.691 |
| 2008 | 2.712 | 2.702 | 3.156 | 3.447 | 3.710 | 3.917 | 4.026 | 3.432 | 3.402 | 2.666 | 2.046 | 1.505 |
| 2009 | 1.530 | 1.358 | 1.299 | 1.464 | 1.496 | 1.817 | 1.796 | 1.961 | 1.852 | 1.933 | 2.064 | 2.039 |
| 2010 | 2.153 | 2.045 | 2.173 | 2.284 | 2.208 | 2.114 | 2.101 | 2.168 | 2.152 | 2.278 | 2.372 | 2.467 |
| 2011 | 2.615 | 2.865 | 3.189 | 3.313 | 3.222 | 3.083 | 3.102 | 3.063 | 3.016 | 2.959 | 3.110 | 2.959 |
| 2012 | 3.092 | 3.202 | 3.309 | 3.276 | 3.124 | 2.759 | 2.912 | 3.141 | 3.249 | 3.196 | 3.073 | 3.034 |
| 2013 | 3.159 | 3.267 | 3.076 | 2.865 | 2.784 | 2.807 | 2.938 | 3.036 | 3.060 | 2.958 | 2.903 | 3.031 |
| 2014 | 3.048 | 3.055 | 3.013 | 2.964 | 2.940 | 2.939 | 2.907 | 2.910 | 2.863 | 2.569 | 2.457 | 2.038 |
| 2015 | 1.663 | 1.790 | 1.779 | 1.742 | 1.920 | 1.830 | 1.671 | 1.493 | 1.472 | 1.465 | 1.428 | 1.223 |
| 2016 | 1.024 | 1.031 | 1.122 | 1.172 | 1.339 | 1.439 | 1.366 | 1.333 | 1.388 | 1.479 | 1.410 | 1.520 |
| 2017 | 1.578 | 1.611 | 1.519 | 1.561 | 1.468 | 1.380 | 1.453 | 1.628 | 1.835 | 1.737 | 1.841 | 1.911 |
| 2018 | 2.036 | 1.957 | 1.913 | 2.076 | 2.228 | 2.164 | 2.162 | 2.170 | 2.226 | 2.310 | 2.115 | 1.834 |
| 2019 | 1.886 | 1.965 | 1.988 | 2.031 | 2.062 | 1.904 | 1.976 | 1.881 | 1.922 | 1.966 | 1.918 | 1.967 |
| 2020 | 1.912 | 1.618 | 1.159 | 0.703 | 0.680 | 1.001 | 1.132 | 1.176 | 1.075 | 1.117 | 1.177 | 1.379 |
| 2021 | 1.476 | 1.613 | 1.732 | 1.699 | 1.816 | 1.898 | 1.954 | 1.902 | 2.032 | 2.308 | 2.305 | 2.156 |
| 2022 | 2.444 | 2.754 | 3.379 | |||||||||
| - = No Data Reported; -- = Not Applicable; NA = Not Available; W = Withheld to avoid disclosure of individual company data. |
| Release Date: 6/1/2022 |
| Next Release Date: TBD |