|
Download Data (XLS File) |
|
||||||||
|
||||||||
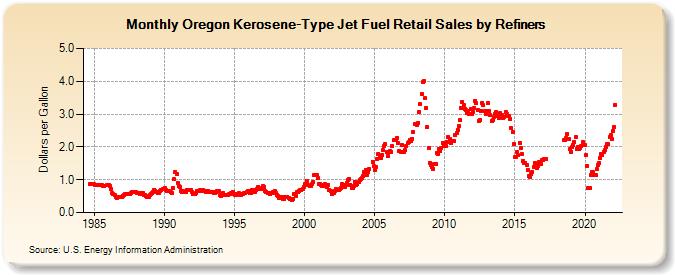
| Oregon Kerosene-Type Jet Fuel Retail Sales by Refiners (Dollars per Gallon) | ||||||||
| Year | Jan | Feb | Mar | Apr | May | Jun | Jul | Aug | Sep | Oct | Nov | Dec |
|---|---|---|---|---|---|---|---|---|---|---|---|---|
| 1984 | 0.862 | 0.861 | W | 0.855 | ||||||||
| 1985 | 0.853 | 0.837 | 0.842 | 0.829 | 0.825 | 0.827 | 0.829 | 0.820 | 0.817 | W | 0.825 | 0.845 |
| 1986 | 0.846 | 0.810 | 0.716 | 0.607 | 0.560 | 0.526 | 0.476 | 0.456 | 0.459 | 0.468 | 0.484 | 0.481 |
| 1987 | 0.505 | 0.541 | 0.555 | 0.571 | 0.562 | 0.559 | 0.576 | 0.607 | 0.625 | 0.640 | 0.634 | 0.614 |
| 1988 | 0.594 | 0.584 | 0.592 | 0.573 | 0.586 | 0.582 | 0.548 | 0.526 | 0.511 | 0.461 | 0.486 | 0.530 |
| 1989 | 0.567 | 0.589 | 0.635 | 0.700 | 0.671 | 0.641 | 0.588 | 0.581 | 0.649 | 0.699 | 0.706 | 0.717 |
| 1990 | 0.751 | 0.699 | 0.670 | 0.662 | 0.647 | 0.614 | 0.608 | 0.760 | 1.008 | 1.233 | 1.177 | 0.908 |
| 1991 | 0.803 | 0.790 | 0.652 | 0.614 | 0.653 | 0.618 | 0.614 | 0.672 | 0.693 | 0.680 | 0.700 | 0.637 |
| 1992 | 0.562 | 0.563 | 0.565 | 0.603 | 0.655 | 0.656 | 0.672 | 0.667 | 0.657 | 0.681 | 0.661 | 0.616 |
| 1993 | 0.623 | 0.665 | 0.641 | 0.641 | 0.639 | 0.636 | 0.600 | 0.599 | 0.615 | 0.671 | 0.654 | 0.533 |
| 1994 | 0.511 | 0.548 | 0.595 | 0.537 | 0.531 | 0.524 | 0.542 | 0.565 | 0.576 | 0.597 | 0.629 | 0.568 |
| 1995 | 0.550 | 0.574 | 0.550 | 0.561 | 0.583 | 0.549 | 0.563 | 0.566 | 0.588 | 0.598 | 0.613 | 0.643 |
| 1996 | 0.653 | 0.581 | 0.585 | 0.694 | 0.695 | 0.623 | 0.672 | 0.728 | 0.791 | NA | 0.705 | 0.752 |
| 1997 | 0.809 | 0.792 | 0.648 | 0.635 | 0.603 | 0.591 | 0.564 | 0.593 | 0.599 | 0.641 | 0.651 | 0.605 |
| 1998 | 0.541 | 0.492 | 0.441 | 0.478 | 0.480 | 0.411 | 0.424 | 0.482 | 0.468 | 0.485 | 0.452 | 0.401 |
| 1999 | 0.408 | 0.391 | 0.416 | 0.565 | 0.512 | 0.626 | 0.613 | 0.645 | 0.676 | 0.681 | 0.723 | 0.766 |
| 2000 | 0.875 | 0.866 | 0.954 | 0.831 | 0.810 | 0.806 | 0.862 | 0.943 | 1.135 | 1.129 | 1.129 | 1.043 |
| 2001 | 0.873 | 0.878 | 0.846 | 0.818 | 0.825 | 0.855 | 0.796 | 0.766 | 0.851 | 0.696 | 0.651 | 0.564 |
| 2002 | 0.597 | 0.593 | 0.668 | 0.704 | 0.695 | 0.686 | 0.712 | 0.762 | 0.868 | 0.839 | 0.773 | 0.825 |
| 2003 | 0.908 | 0.985 | 1.034 | 0.854 | 0.743 | 0.740 | 0.821 | 0.926 | 0.832 | 0.861 | 0.918 | 0.988 |
| 2004 | 1.037 | 1.065 | 1.112 | 1.229 | 1.311 | 1.139 | 1.224 | 1.315 | NA | NA | 1.554 | 1.404 |
| 2005 | 1.290 | 1.397 | 1.624 | 1.785 | 1.694 | 1.659 | 1.749 | 1.895 | 2.034 | 2.076 | 1.833 | 1.723 |
| 2006 | 1.849 | 1.890 | 1.855 | 2.018 | 2.196 | 2.208 | 2.221 | 2.281 | 2.113 | 1.874 | 1.859 | 2.054 |
| 2007 | 1.857 | 1.839 | 1.896 | 2.024 | 2.118 | 2.149 | 2.196 | 2.188 | 2.250 | 2.460 | 2.697 | 2.705 |
| 2008 | 2.672 | 2.738 | 3.073 | 3.298 | 3.612 | 3.964 | 4.015 | 3.479 | 3.197 | 2.604 | 1.970 | 1.518 |
| 2009 | 1.455 | 1.378 | 1.334 | 1.471 | 1.491 | 1.822 | 1.787 | 1.934 | 1.861 | 1.960 | 2.106 | 2.041 |
| 2010 | 2.130 | 2.033 | 2.152 | 2.294 | 2.238 | 2.129 | 2.174 | 2.191 | 2.175 | 2.351 | 2.418 | 2.523 |
| 2011 | 2.632 | 2.816 | 3.171 | 3.367 | 3.280 | 3.162 | 3.120 | 3.025 | 3.085 | 3.008 | 3.147 | 3.012 |
| 2012 | 3.065 | 3.191 | 3.406 | 3.326 | 3.137 | 2.796 | 2.816 | 3.106 | 3.340 | 3.262 | 3.088 | 3.016 |
| 2013 | 3.103 | 3.330 | 3.092 | 2.965 | 2.798 | 2.816 | 2.912 | 2.992 | 3.058 | 2.938 | 2.889 | 3.022 |
| 2014 | 2.984 | 2.961 | 2.880 | 2.914 | 3.063 | 2.997 | 2.939 | 2.934 | 2.854 | 2.572 | 2.450 | 2.084 |
| 2015 | 1.692 | 1.692 | 1.830 | 1.739 | 2.122 | 1.964 | 1.780 | 1.583 | 1.497 | 1.517 | 1.459 | 1.295 |
| 2016 | 1.109 | 1.070 | 1.181 | 1.244 | 1.384 | 1.513 | 1.456 | 1.343 | 1.421 | 1.552 | 1.489 | 1.595 |
| 2017 | 1.609 | 1.643 | 1.619 | 1.636 | W | W | W | W | W | W | W | W |
| 2018 | W | W | W | W | W | W | 2.208 | 2.208 | 2.280 | 2.403 | 2.248 | 1.927 |
| 2019 | 1.855 | 2.005 | 2.054 | 2.142 | 2.294 | 1.922 | 2.003 | 1.928 | 1.961 | 2.040 | 2.148 | 2.065 |
| 2020 | 2.052 | 1.740 | 1.421 | 0.753 | 0.746 | 1.131 | 1.238 | 1.224 | 1.134 | 1.152 | 1.321 | 1.444 |
| 2021 | 1.504 | 1.653 | 1.797 | 1.748 | 1.852 | 1.893 | 1.995 | 2.093 | 2.073 | 2.316 | 2.355 | 2.228 |
| 2022 | 2.487 | 2.599 | 3.285 | |||||||||
| - = No Data Reported; -- = Not Applicable; NA = Not Available; W = Withheld to avoid disclosure of individual company data. |
| Release Date: 6/1/2022 |
| Next Release Date: TBD |