|
Download Data (XLS File) |
|
||||||||
|
||||||||
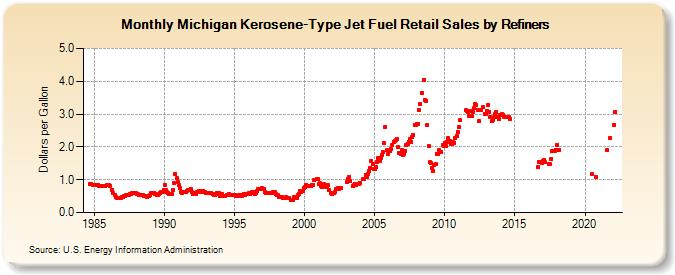
| Michigan Kerosene-Type Jet Fuel Retail Sales by Refiners (Dollars per Gallon) | ||||||||
| Year | Jan | Feb | Mar | Apr | May | Jun | Jul | Aug | Sep | Oct | Nov | Dec |
|---|---|---|---|---|---|---|---|---|---|---|---|---|
| 1984 | 0.855 | 0.857 | 0.851 | 0.847 | ||||||||
| 1985 | 0.843 | 0.839 | 0.832 | 0.831 | 0.822 | 0.810 | 0.805 | 0.805 | 0.812 | 0.820 | 0.825 | 0.833 |
| 1986 | 0.830 | 0.812 | NA | 0.697 | 0.582 | 0.530 | 0.475 | 0.435 | 0.442 | 0.442 | 0.450 | 0.463 |
| 1987 | 0.471 | 0.510 | 0.515 | 0.526 | 0.532 | 0.538 | 0.566 | 0.578 | 0.588 | 0.594 | 0.600 | 0.584 |
| 1988 | 0.565 | 0.556 | 0.537 | 0.527 | 0.533 | 0.525 | 0.504 | 0.497 | 0.498 | 0.482 | 0.494 | 0.530 |
| 1989 | 0.587 | 0.586 | 0.584 | 0.595 | 0.577 | 0.545 | 0.549 | 0.551 | 0.588 | 0.635 | 0.635 | 0.696 |
| 1990 | 0.847 | 0.687 | 0.616 | 0.590 | 0.570 | 0.556 | 0.552 | 0.702 | 0.908 | 1.169 | 1.042 | 0.920 |
| 1991 | 0.828 | 0.733 | 0.622 | 0.603 | 0.615 | 0.615 | 0.618 | 0.651 | 0.678 | 0.698 | 0.721 | 0.635 |
| 1992 | 0.565 | 0.586 | 0.562 | 0.578 | 0.612 | 0.645 | 0.651 | 0.641 | 0.650 | 0.669 | 0.624 | 0.592 |
| 1993 | 0.589 | 0.588 | 0.607 | 0.582 | 0.597 | 0.578 | 0.549 | 0.541 | 0.563 | 0.605 | 0.583 | 0.517 |
| 1994 | 0.517 | 0.565 | 0.490 | 0.496 | 0.507 | 0.520 | 0.543 | 0.551 | 0.532 | 0.541 | 0.550 | 0.536 |
| 1995 | 0.527 | 0.505 | 0.495 | 0.519 | 0.542 | 0.533 | 0.506 | 0.520 | 0.558 | 0.525 | 0.559 | 0.573 |
| 1996 | 0.605 | 0.552 | 0.588 | 0.627 | 0.613 | 0.572 | 0.581 | 0.642 | 0.707 | 0.729 | 0.719 | 0.744 |
| 1997 | 0.724 | 0.715 | 0.619 | 0.598 | 0.585 | 0.586 | 0.588 | 0.600 | 0.586 | 0.618 | 0.617 | 0.569 |
| 1998 | 0.534 | 0.530 | 0.472 | 0.482 | 0.484 | 0.453 | 0.457 | 0.438 | 0.463 | NA | 0.456 | NA |
| 1999 | 0.388 | 0.371 | 0.381 | 0.472 | 0.476 | 0.453 | 0.528 | 0.580 | 0.643 | 0.636 | 0.670 | 0.752 |
| 2000 | 0.770 | 0.833 | 0.820 | 0.799 | 0.795 | 0.810 | 0.847 | 0.846 | 0.991 | NA | 1.025 | 1.021 |
| 2001 | 0.881 | 0.886 | 0.806 | 0.785 | 0.863 | 0.849 | 0.790 | 0.803 | 0.829 | 0.687 | 0.598 | 0.561 |
| 2002 | 0.589 | 0.591 | 0.641 | 0.730 | 0.742 | 0.716 | W | 0.747 | W | W | W | W |
| 2003 | 0.919 | 1.021 | 1.077 | 0.955 | NA | 0.803 | 0.831 | 0.870 | 0.833 | NA | 0.884 | 0.910 |
| 2004 | W | W | 1.021 | 1.022 | 1.148 | 1.097 | 1.176 | 1.274 | 1.351 | 1.563 | 1.468 | 1.339 |
| 2005 | 1.335 | 1.386 | 1.554 | 1.660 | 1.585 | 1.652 | 1.759 | 1.832 | 2.110 | 2.621 | 1.896 | 1.772 |
| 2006 | 1.864 | 1.866 | 1.921 | 2.059 | 2.162 | 2.187 | 2.201 | 2.232 | 1.985 | 1.827 | 1.786 | 1.901 |
| 2007 | 1.748 | 1.786 | 1.881 | 2.063 | 2.100 | 2.162 | 2.230 | 2.164 | 2.287 | 2.366 | 2.669 | 2.675 |
| 2008 | 2.699 | 2.702 | 3.116 | 3.307 | 3.656 | NA | 4.032 | 3.431 | 3.409 | 2.665 | 2.020 | 1.530 |
| 2009 | 1.495 | 1.365 | 1.258 | 1.457 | 1.470 | 1.792 | 1.781 | 1.913 | 1.836 | 1.852 | 2.050 | 2.012 |
| 2010 | 2.130 | 2.014 | 2.142 | 2.257 | 2.186 | 2.103 | 2.079 | 2.146 | 2.128 | 2.267 | 2.345 | 2.460 |
| 2011 | 2.603 | 2.808 | W | W | W | W | 3.111 | 3.090 | 3.049 | 2.955 | 3.096 | 2.928 |
| 2012 | 3.075 | 3.192 | 3.314 | 3.290 | 3.137 | 2.776 | W | 3.123 | W | 3.204 | 3.004 | 3.003 |
| 2013 | 3.107 | 3.278 | 3.072 | 2.906 | 2.775 | 2.820 | 2.908 | 3.001 | 3.048 | 2.921 | 2.863 | 2.975 |
| 2014 | 2.980 | 2.997 | 2.985 | 2.921 | 2.924 | 2.918 | 2.905 | 2.899 | 2.852 | W | W | W |
| 2015 | W | W | W | W | W | W | W | W | W | W | W | W |
| 2016 | W | W | W | W | W | W | W | W | 1.381 | 1.539 | W | 1.511 |
| 2017 | 1.583 | 1.607 | 1.526 | W | W | 1.464 | 1.480 | 1.628 | 1.861 | NA | 1.880 | 1.907 |
| 2018 | 2.063 | W | 1.915 | W | W | W | W | W | W | W | W | W |
| 2019 | W | W | W | W | W | W | W | W | W | W | W | W |
| 2020 | W | W | W | W | W | W | 1.173 | W | W | 1.084 | W | W |
| 2021 | W | W | W | W | W | W | W | 1.892 | W | 2.261 | W | W |
| 2022 | W | 2.667 | 3.073 | |||||||||
| - = No Data Reported; -- = Not Applicable; NA = Not Available; W = Withheld to avoid disclosure of individual company data. |
| Release Date: 6/1/2022 |
| Next Release Date: TBD |