|
Download Data (XLS File) |
|
||||||||
|
||||||||
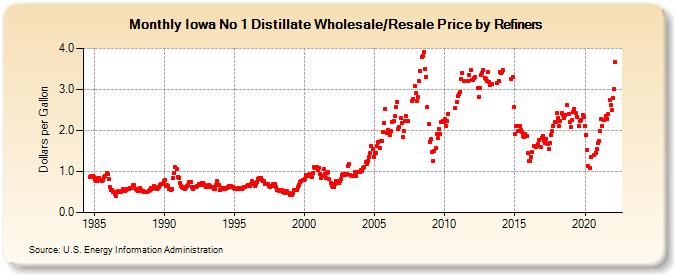
| Iowa No 1 Distillate Wholesale/Resale Price by Refiners (Dollars per Gallon) | ||||||||
| Year | Jan | Feb | Mar | Apr | May | Jun | Jul | Aug | Sep | Oct | Nov | Dec |
|---|---|---|---|---|---|---|---|---|---|---|---|---|
| 1984 | 0.869 | 0.892 | 0.887 | 0.867 | ||||||||
| 1985 | 0.804 | 0.765 | 0.781 | 0.853 | 0.853 | 0.785 | 0.761 | 0.801 | 0.858 | 0.900 | 0.956 | 0.946 |
| 1986 | 0.811 | 0.611 | 0.542 | 0.553 | 0.505 | 0.460 | 0.415 | 0.499 | 0.514 | 0.495 | 0.513 | 0.518 |
| 1987 | 0.563 | 0.533 | 0.532 | 0.545 | 0.567 | 0.580 | 0.601 | 0.610 | 0.592 | 0.674 | 0.667 | 0.582 |
| 1988 | 0.555 | 0.525 | 0.517 | 0.587 | 0.555 | 0.517 | 0.495 | 0.506 | 0.498 | 0.504 | 0.537 | 0.559 |
| 1989 | 0.590 | 0.578 | 0.603 | 0.657 | 0.619 | 0.576 | 0.588 | 0.612 | 0.674 | 0.694 | 0.704 | 0.776 |
| 1990 | 0.783 | 0.656 | 0.665 | 0.638 | 0.585 | 0.543 | 0.579 | 0.850 | 0.968 | 1.104 | 1.071 | 0.872 |
| 1991 | 0.841 | 0.722 | 0.645 | 0.628 | 0.601 | 0.572 | 0.615 | 0.652 | 0.678 | 0.740 | 0.753 | 0.629 |
| 1992 | 0.579 | 0.615 | 0.613 | 0.632 | 0.658 | 0.690 | 0.689 | 0.682 | 0.716 | 0.732 | 0.666 | 0.623 |
| 1993 | 0.618 | 0.644 | 0.666 | 0.641 | 0.632 | 0.612 | 0.566 | 0.573 | 0.675 | 0.759 | 0.671 | 0.546 |
| 1994 | 0.572 | 0.598 | 0.601 | 0.588 | 0.583 | 0.599 | 0.634 | 0.636 | 0.611 | 0.636 | 0.624 | 0.592 |
| 1995 | 0.585 | 0.567 | 0.571 | 0.603 | 0.604 | 0.577 | 0.572 | 0.606 | 0.621 | 0.612 | 0.643 | 0.672 |
| 1996 | 0.635 | 0.655 | 0.690 | 0.778 | 0.723 | 0.652 | 0.691 | 0.749 | 0.819 | 0.853 | 0.834 | 0.793 |
| 1997 | 0.779 | 0.758 | 0.687 | 0.684 | 0.705 | 0.651 | 0.623 | 0.640 | 0.638 | 0.694 | 0.694 | 0.625 |
| 1998 | 0.551 | 0.554 | 0.530 | 0.561 | 0.543 | 0.499 | 0.508 | 0.479 | 0.514 | 0.519 | 0.479 | 0.426 |
| 1999 | 0.452 | 0.440 | 0.481 | 0.558 | 0.543 | 0.550 | 0.627 | 0.682 | 0.745 | 0.763 | 0.787 | 0.790 |
| 2000 | 0.824 | 0.909 | 0.914 | 0.890 | 0.929 | 0.927 | 0.868 | 0.968 | 1.109 | 1.084 | 1.105 | 1.048 |
| 2001 | 1.087 | 0.944 | 0.834 | 0.899 | 1.059 | 0.939 | 0.831 | 0.955 | 0.982 | 0.815 | 0.725 | 0.650 |
| 2002 | 0.617 | 0.614 | 0.690 | 0.769 | 0.743 | 0.712 | 0.762 | 0.819 | 0.923 | 0.948 | 0.925 | 0.930 |
| 2003 | 0.945 | 1.141 | 1.177 | 0.917 | 0.891 | 0.882 | 0.900 | 0.983 | 0.886 | 0.991 | 0.981 | 0.987 |
| 2004 | 1.027 | 1.009 | 1.075 | 1.122 | 1.224 | 1.186 | 1.260 | 1.358 | 1.450 | 1.628 | 1.542 | 1.364 |
| 2005 | 1.448 | 1.459 | 1.623 | 1.714 | 1.562 | 1.755 | 1.754 | 1.968 | 2.192 | 2.524 | 1.941 | 2.023 |
| 2006 | 1.951 | 1.896 | 1.984 | 2.218 | 2.232 | 2.346 | 2.562 | 2.693 | 2.024 | 2.090 | 2.310 | 2.193 |
| 2007 | 1.831 | 1.982 | 2.239 | 2.354 | 2.235 | NA | W | W | 2.729 | 2.779 | 3.087 | 2.923 |
| 2008 | 2.706 | 2.817 | 3.194 | 3.451 | 3.781 | 3.821 | 3.920 | 3.507 | 3.309 | 2.577 | 2.158 | 1.727 |
| 2009 | 1.782 | 1.475 | 1.253 | 1.489 | 1.578 | 1.919 | 1.806 | 2.032 | 1.918 | 2.203 | 2.238 | 2.217 |
| 2010 | 2.271 | 2.116 | 2.224 | 2.402 | W | W | W | W | W | 2.557 | 2.704 | 2.831 |
| 2011 | 2.884 | 2.935 | 3.248 | 3.412 | 3.213 | W | W | W | 3.201 | 3.362 | 3.467 | 3.227 |
| 2012 | 3.220 | 3.269 | 3.307 | W | 3.025 | 2.826 | 3.032 | 3.341 | 3.394 | 3.476 | 3.287 | 3.250 |
| 2013 | 3.208 | 3.414 | 3.184 | 3.115 | 3.122 | W | W | W | - | 3.166 | 3.214 | 3.417 |
| 2014 | 3.403 | 3.431 | 3.467 | W | - | W | W | W | W | 3.259 | 3.309 | 2.563 |
| 2015 | 1.911 | 2.103 | 2.117 | 1.995 | 2.108 | 2.019 | 1.961 | 1.873 | 1.842 | 1.922 | 1.868 | 1.460 |
| 2016 | 1.246 | 1.250 | 1.354 | 1.472 | 1.623 | W | 1.587 | 1.613 | 1.674 | 1.780 | 1.589 | 1.822 |
| 2017 | 1.873 | 1.750 | 1.699 | 1.794 | 1.682 | 1.544 | 1.700 | 1.878 | 1.997 | 2.118 | 2.205 | 2.215 |
| 2018 | 2.421 | 2.297 | 2.113 | 2.243 | 2.417 | 2.386 | 2.312 | 2.386 | W | 2.620 | 2.408 | 2.196 |
| 2019 | 2.085 | 2.264 | 2.461 | 2.532 | 2.434 | 2.332 | W | 2.109 | 2.240 | 2.263 | 2.383 | 2.337 |
| 2020 | 2.121 | 1.896 | 1.526 | 1.138 | 1.077 | 1.351 | W | W | 1.403 | 1.449 | 1.544 | 1.685 |
| 2021 | 1.747 | 1.997 | 2.276 | 2.114 | 2.244 | W | 2.346 | 2.288 | 2.402 | 2.745 | 2.611 | 2.500 |
| 2022 | 2.780 | 3.022 | 3.666 | |||||||||
| - = No Data Reported; -- = Not Applicable; NA = Not Available; W = Withheld to avoid disclosure of individual company data. |
| Release Date: 6/1/2022 |
| Next Release Date: TBD |