|
Download Data (XLS File) |
|
||||||||
|
||||||||
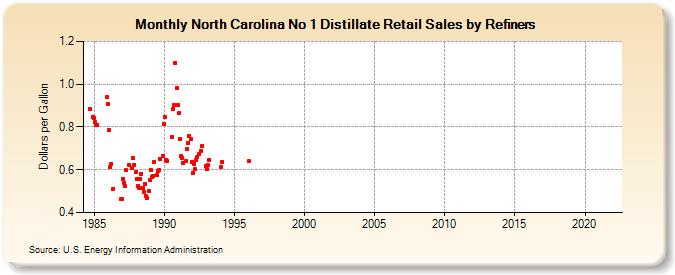
| North Carolina No 1 Distillate Retail Sales by Refiners (Dollars per Gallon) | ||||||||
| Year | Jan | Feb | Mar | Apr | May | Jun | Jul | Aug | Sep | Oct | Nov | Dec |
|---|---|---|---|---|---|---|---|---|---|---|---|---|
| 1984 | 0.885 | W | 0.848 | 0.842 | ||||||||
| 1985 | 0.821 | 0.811 | 0.810 | W | W | - | - | - | W | W | 0.939 | 0.907 |
| 1986 | 0.784 | 0.615 | 0.627 | W | 0.511 | - | - | - | W | W | 0.461 | 0.465 |
| 1987 | 0.557 | 0.538 | 0.525 | 0.597 | W | 0.620 | W | - | 0.610 | 0.655 | 0.624 | 0.591 |
| 1988 | 0.558 | 0.524 | 0.515 | 0.559 | 0.581 | 0.513 | 0.497 | 0.533 | 0.477 | 0.470 | 0.499 | 0.552 |
| 1989 | 0.597 | 0.565 | 0.572 | 0.635 | W | 0.574 | 0.593 | 0.598 | 0.649 | W | 0.664 | 0.812 |
| 1990 | 0.846 | 0.647 | 0.643 | W | W | W | 0.755 | 0.882 | 0.903 | 1.098 | 0.982 | 0.902 |
| 1991 | 0.863 | 0.744 | 0.664 | 0.656 | 0.633 | W | 0.642 | 0.698 | 0.726 | 0.757 | 0.743 | 0.637 |
| 1992 | 0.585 | 0.628 | 0.602 | 0.645 | 0.660 | 0.672 | W | 0.689 | 0.711 | W | W | 0.618 |
| 1993 | 0.603 | 0.622 | 0.646 | W | W | W | NA | W | W | W | W | W |
| 1994 | 0.612 | 0.638 | W | - | - | - | - | - | - | - | - | W |
| 1995 | W | W | W | - | - | - | - | - | - | - | W | W |
| 1996 | 0.639 | W | W | W | - | - | - | - | - | - | W | W |
| 1997 | W | - | - | - | - | - | - | - | - | - | - | W |
| 1998 | W | W | - | - | - | - | - | W | - | - | - | - |
| 1999 | W | W | W | W | - | - | - | - | - | - | - | - |
| 2000 | - | - | W | W | - | - | - | - | - | - | - | - |
| 2001 | - | - | - | - | - | - | - | - | - | - | - | - |
| 2002 | - | W | - | - | - | - | - | - | - | W | W | - |
| 2003 | W | - | - | - | - | - | - | - | - | - | - | - |
| 2004 | W | - | - | - | - | - | - | - | W | W | W | W |
| 2005 | W | W | W | W | W | W | W | W | - | - | - | - |
| 2006 | - | - | - | - | - | - | - | - | - | - | - | - |
| 2007 | - | - | - | - | - | - | - | - | - | - | - | - |
| 2008 | - | - | - | - | - | - | - | - | - | - | - | - |
| 2009 | - | - | - | - | - | - | - | - | - | - | - | - |
| 2010 | - | - | - | - | - | - | - | - | - | - | - | - |
| 2011 | - | - | - | - | - | - | - | - | - | - | - | - |
| 2012 | - | - | - | - | - | - | - | - | - | - | - | - |
| 2013 | - | - | - | - | - | - | - | - | - | - | - | - |
| 2014 | - | - | - | - | - | - | - | - | - | - | - | - |
| 2015 | - | - | - | - | - | - | - | - | - | - | - | - |
| 2016 | - | - | - | - | - | - | - | - | - | - | - | - |
| 2017 | - | - | - | - | - | - | - | - | - | - | - | - |
| 2018 | - | - | - | - | - | - | - | - | - | - | - | - |
| 2019 | - | - | - | - | - | - | - | - | - | - | - | - |
| 2020 | - | - | - | - | - | - | - | - | - | - | - | - |
| 2021 | - | - | - | - | - | - | - | - | - | - | - | - |
| 2022 | - | - | - | |||||||||
| - = No Data Reported; -- = Not Applicable; NA = Not Available; W = Withheld to avoid disclosure of individual company data. |
| Release Date: 6/1/2022 |
| Next Release Date: TBD |