|
Download Data (XLS File) |
|
||||||||
|
||||||||
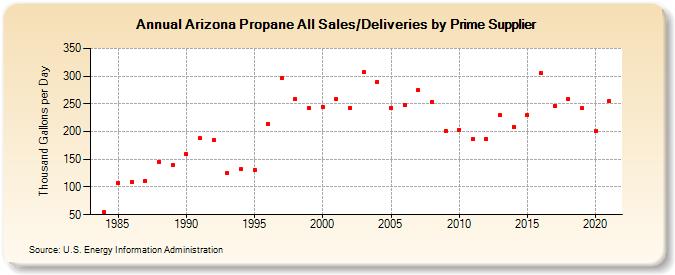
| Arizona Propane All Sales/Deliveries by Prime Supplier (Thousand Gallons per Day) | ||||||||
| Decade | Year-0 | Year-1 | Year-2 | Year-3 | Year-4 | Year-5 | Year-6 | Year-7 | Year-8 | Year-9 |
|---|---|---|---|---|---|---|---|---|---|---|
| 1980's | W | 54.4 | 108.0 | 108.6 | 110.4 | 145.4 | 140.1 | |||
| 1990's | 158.9 | 188.0 | 185.5 | 125.0 | 132.0 | 131.5 | 214.2 | 296.4 | 259.0 | 242.4 |
| 2000's | 244.1 | 259.1 | 242.8 | 306.8 | 289.8 | 242.8 | 248.5 | 274.7 | 253.6 | 201.6 |
| 2010's | 203.7 | 186.4 | 186.8 | 229.4 | 209.0 | 229.1 | 305.2 | 246.8 | 258.3 | 241.9 |
| 2020's | 200.6 |
| - = No Data Reported; -- = Not Applicable; NA = Not Available; W = Withheld to avoid disclosure of individual company data. |
| Release Date: 6/1/2022 |
| Next Release Date: TBD |