|
Download Data (XLS File) |
|
||||||||
|
||||||||
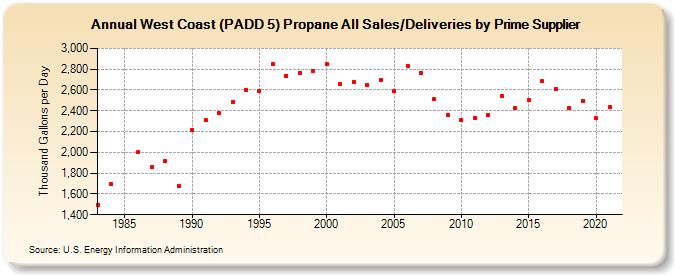
| West Coast (PADD 5) Propane All Sales/Deliveries by Prime Supplier (Thousand Gallons per Day) | ||||||||
| Decade | Year-0 | Year-1 | Year-2 | Year-3 | Year-4 | Year-5 | Year-6 | Year-7 | Year-8 | Year-9 |
|---|---|---|---|---|---|---|---|---|---|---|
| 1980's | 1,495.8 | 1,695.1 | W | 2,002.0 | 1,855.0 | 1,912.4 | 1,675.3 | |||
| 1990's | 2,212.6 | 2,308.7 | 2,375.5 | 2,484.8 | 2,600.9 | 2,590.0 | 2,845.1 | 2,739.2 | 2,765.0 | 2,778.9 |
| 2000's | 2,846.9 | 2,661.2 | 2,681.4 | 2,649.8 | 2,700.1 | 2,589.0 | 2,831.9 | 2,759.2 | 2,515.4 | 2,363.4 |
| 2010's | 2,312.5 | 2,329.9 | 2,359.0 | 2,542.6 | 2,422.7 | 2,500.9 | 2,681.9 | 2,610.6 | 2,429.7 | 2,491.2 |
| 2020's | 2,325.8 |
| - = No Data Reported; -- = Not Applicable; NA = Not Available; W = Withheld to avoid disclosure of individual company data. |
| Release Date: 6/1/2022 |
| Next Release Date: TBD |