|
Download Data (XLS File) |
|
||||||||
|
||||||||
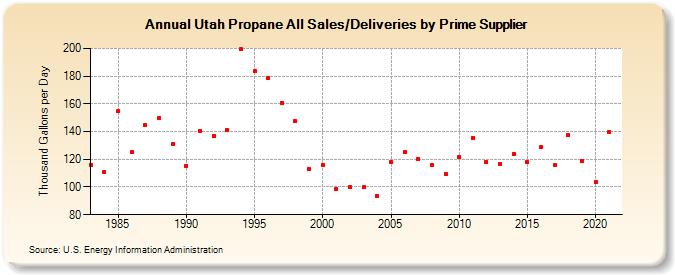
| Utah Propane All Sales/Deliveries by Prime Supplier (Thousand Gallons per Day) | ||||||||
| Decade | Year-0 | Year-1 | Year-2 | Year-3 | Year-4 | Year-5 | Year-6 | Year-7 | Year-8 | Year-9 |
|---|---|---|---|---|---|---|---|---|---|---|
| 1980's | 116.2 | 110.8 | 154.6 | 125.2 | 144.8 | 149.9 | 130.8 | |||
| 1990's | 115.4 | 140.7 | 136.6 | 141.2 | 199.2 | 183.8 | 178.4 | 160.6 | 147.5 | 112.9 |
| 2000's | 115.8 | 98.7 | 99.9 | 99.8 | 93.3 | 118.0 | 125.0 | 120.1 | 115.7 | 109.5 |
| 2010's | 121.9 | 135.5 | 118.2 | 116.7 | 124.0 | 117.8 | 128.9 | 116.0 | 137.2 | 119.1 |
| 2020's | 103.6 |
| - = No Data Reported; -- = Not Applicable; NA = Not Available; W = Withheld to avoid disclosure of individual company data. |
| Release Date: 6/1/2022 |
| Next Release Date: TBD |