|
Download Data (XLS File) |
|
||||||||
|
||||||||
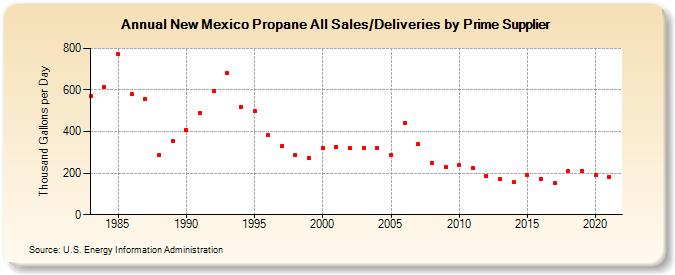
| New Mexico Propane All Sales/Deliveries by Prime Supplier (Thousand Gallons per Day) | ||||||||
| Decade | Year-0 | Year-1 | Year-2 | Year-3 | Year-4 | Year-5 | Year-6 | Year-7 | Year-8 | Year-9 |
|---|---|---|---|---|---|---|---|---|---|---|
| 1980's | 571.9 | 612.6 | 771.9 | 579.0 | 556.0 | 285.7 | 355.0 | |||
| 1990's | 407.4 | 489.0 | 594.8 | 680.4 | 520.2 | 498.2 | 381.9 | 329.9 | 286.4 | 272.8 |
| 2000's | 323.1 | 325.7 | 319.4 | 319.3 | 318.7 | 288.6 | 442.0 | 338.9 | 250.7 | 230.2 |
| 2010's | 237.4 | 224.3 | 186.7 | 172.7 | 155.2 | 191.1 | 173.8 | 154.0 | 208.3 | 210.5 |
| 2020's | 190.4 |
| - = No Data Reported; -- = Not Applicable; NA = Not Available; W = Withheld to avoid disclosure of individual company data. |
| Release Date: 6/1/2022 |
| Next Release Date: TBD |