|
Download Data (XLS File) |
|
||||||||
|
||||||||
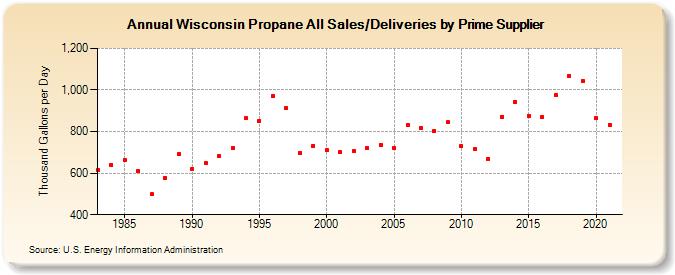
| Wisconsin Propane All Sales/Deliveries by Prime Supplier (Thousand Gallons per Day) | ||||||||
| Decade | Year-0 | Year-1 | Year-2 | Year-3 | Year-4 | Year-5 | Year-6 | Year-7 | Year-8 | Year-9 |
|---|---|---|---|---|---|---|---|---|---|---|
| 1980's | 614.1 | 640.3 | 663.5 | 609.1 | 497.5 | 577.8 | 690.1 | |||
| 1990's | 622.0 | 647.1 | 681.8 | 720.1 | 863.3 | 851.3 | 971.0 | 912.0 | 698.6 | 732.0 |
| 2000's | 710.3 | 700.2 | 705.8 | 719.9 | 737.4 | 723.0 | 831.7 | 817.9 | 802.6 | 844.2 |
| 2010's | 729.4 | 715.8 | 670.3 | 871.3 | 942.1 | 876.5 | 869.0 | 973.5 | 1,067.2 | 1,045.2 |
| 2020's | 865.1 |
| - = No Data Reported; -- = Not Applicable; NA = Not Available; W = Withheld to avoid disclosure of individual company data. |
| Release Date: 6/1/2022 |
| Next Release Date: TBD |