|
Download Data (XLS File) |
|
||||||||
|
||||||||
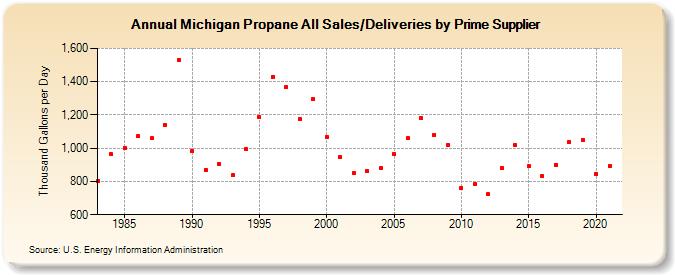
| Michigan Propane All Sales/Deliveries by Prime Supplier (Thousand Gallons per Day) | ||||||||
| Decade | Year-0 | Year-1 | Year-2 | Year-3 | Year-4 | Year-5 | Year-6 | Year-7 | Year-8 | Year-9 |
|---|---|---|---|---|---|---|---|---|---|---|
| 1980's | 805.1 | 963.5 | 1,002.9 | 1,071.3 | 1,059.3 | 1,140.3 | 1,531.3 | |||
| 1990's | 984.4 | 870.9 | 905.4 | 836.0 | 992.9 | 1,185.3 | 1,430.3 | 1,366.4 | 1,176.3 | 1,294.9 |
| 2000's | 1,067.4 | 946.7 | 850.0 | 860.7 | 878.7 | 964.9 | 1,061.1 | 1,178.5 | 1,081.2 | 1,020.9 |
| 2010's | 759.2 | 782.7 | 721.6 | 883.7 | 1,016.4 | 892.0 | 833.8 | 900.6 | 1,036.8 | 1,050.6 |
| 2020's | 846.3 |
| - = No Data Reported; -- = Not Applicable; NA = Not Available; W = Withheld to avoid disclosure of individual company data. |
| Release Date: 6/1/2022 |
| Next Release Date: TBD |