|
Download Data (XLS File) |
|
||||||||
|
||||||||
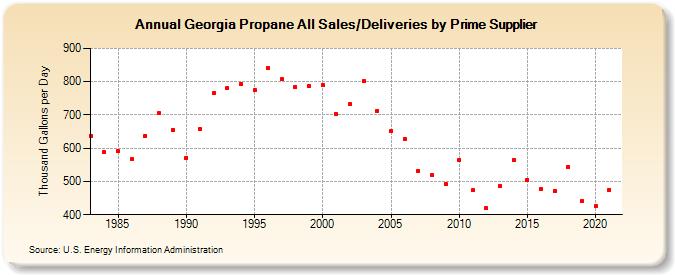
| Georgia Propane All Sales/Deliveries by Prime Supplier (Thousand Gallons per Day) | ||||||||
| Decade | Year-0 | Year-1 | Year-2 | Year-3 | Year-4 | Year-5 | Year-6 | Year-7 | Year-8 | Year-9 |
|---|---|---|---|---|---|---|---|---|---|---|
| 1980's | 637.7 | 587.4 | 590.3 | 566.3 | 637.9 | 705.0 | 655.8 | |||
| 1990's | 571.3 | 656.8 | 765.4 | 780.1 | 793.2 | 774.3 | 840.5 | 807.0 | 784.4 | 786.5 |
| 2000's | 788.6 | 701.4 | 732.7 | 801.4 | 712.6 | 652.0 | 629.0 | 532.4 | 518.6 | 491.5 |
| 2010's | 565.0 | 473.0 | 419.5 | 485.9 | 565.8 | 504.5 | 476.9 | 471.7 | 542.9 | 441.8 |
| 2020's | 425.0 |
| - = No Data Reported; -- = Not Applicable; NA = Not Available; W = Withheld to avoid disclosure of individual company data. |
| Release Date: 6/1/2022 |
| Next Release Date: TBD |