|
Download Data (XLS File) |
|
||||||||
|
||||||||
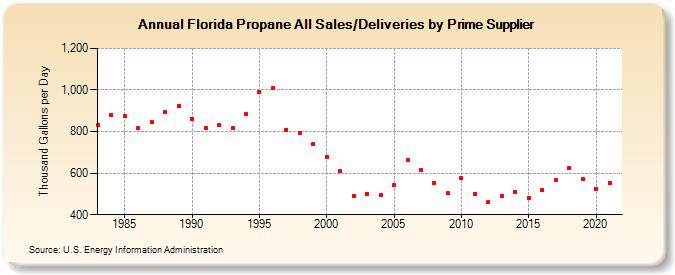
| Florida Propane All Sales/Deliveries by Prime Supplier (Thousand Gallons per Day) | ||||||||
| Decade | Year-0 | Year-1 | Year-2 | Year-3 | Year-4 | Year-5 | Year-6 | Year-7 | Year-8 | Year-9 |
|---|---|---|---|---|---|---|---|---|---|---|
| 1980's | 833.5 | 880.1 | 875.6 | 816.1 | 848.1 | 892.8 | 924.2 | |||
| 1990's | 861.9 | 815.3 | 829.4 | 816.3 | 883.7 | 990.6 | 1,009.3 | 809.6 | 791.1 | 740.9 |
| 2000's | 679.6 | 609.5 | 490.9 | 499.8 | 495.6 | 540.8 | 661.3 | 613.3 | 553.5 | 505.4 |
| 2010's | 575.8 | 500.2 | 461.5 | 492.2 | 510.2 | 481.2 | 519.6 | 564.7 | 626.8 | 569.5 |
| 2020's | 525.9 |
| - = No Data Reported; -- = Not Applicable; NA = Not Available; W = Withheld to avoid disclosure of individual company data. |
| Release Date: 6/1/2022 |
| Next Release Date: TBD |