|
Download Data (XLS File) |
|
||||||||
|
||||||||
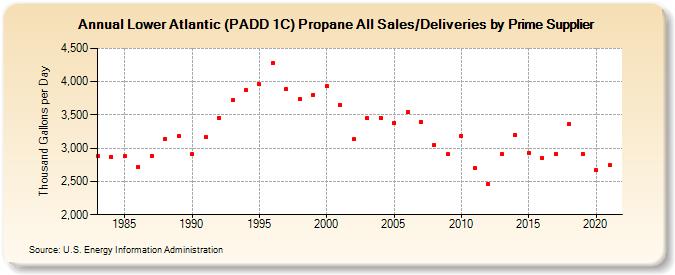
| Lower Atlantic (PADD 1C) Propane All Sales/Deliveries by Prime Supplier (Thousand Gallons per Day) | ||||||||
| Decade | Year-0 | Year-1 | Year-2 | Year-3 | Year-4 | Year-5 | Year-6 | Year-7 | Year-8 | Year-9 |
|---|---|---|---|---|---|---|---|---|---|---|
| 1980's | 2,877.7 | 2,873.2 | 2,875.6 | 2,723.6 | 2,887.0 | 3,144.1 | 3,177.4 | |||
| 1990's | 2,911.7 | 3,166.1 | 3,447.5 | 3,717.4 | 3,876.1 | 3,960.1 | 4,283.7 | 3,888.4 | 3,742.2 | 3,805.5 |
| 2000's | 3,933.5 | 3,653.6 | 3,130.8 | 3,447.4 | 3,457.7 | 3,379.7 | 3,539.9 | 3,400.3 | 3,046.0 | 2,910.4 |
| 2010's | 3,187.7 | 2,701.9 | 2,457.1 | 2,912.2 | 3,195.4 | 2,930.8 | 2,857.3 | 2,916.3 | 3,358.9 | 2,915.3 |
| 2020's | 2,667.7 |
| - = No Data Reported; -- = Not Applicable; NA = Not Available; W = Withheld to avoid disclosure of individual company data. |
| Release Date: 6/1/2022 |
| Next Release Date: TBD |