|
Download Data (XLS File) |
|
||||||||
|
||||||||
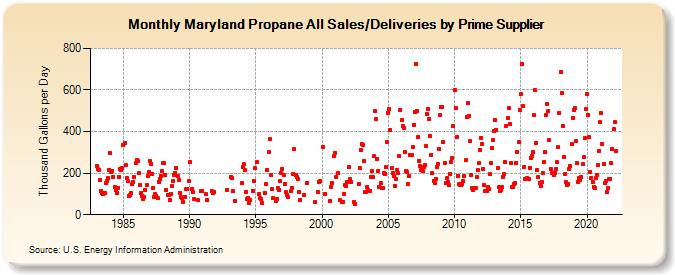
| Maryland Propane All Sales/Deliveries by Prime Supplier (Thousand Gallons per Day) | ||||||||
| Year | Jan | Feb | Mar | Apr | May | Jun | Jul | Aug | Sep | Oct | Nov | Dec |
|---|---|---|---|---|---|---|---|---|---|---|---|---|
| 1983 | 234.5 | 218.8 | 216.6 | 168.0 | 116.3 | 105.0 | 99.6 | 105.4 | 151.2 | 163.8 | 175.7 | 216.5 |
| 1984 | 298.4 | 204.8 | 209.9 | 182.8 | 131.1 | 117.6 | 103.8 | 128.6 | 182.6 | 220.5 | 213.0 | 225.5 |
| 1985 | 333.2 | 343.9 | 239.6 | 177.9 | 162.4 | 90.1 | 93.4 | 104.9 | 145.8 | 157.8 | 182.0 | 249.5 |
| 1986 | 263.4 | 256.1 | 198.6 | 142.0 | 105.7 | 91.8 | 77.9 | 83.8 | 120.9 | 141.4 | 187.5 | 206.9 |
| 1987 | 259.3 | 245.6 | 196.2 | 130.5 | 84.6 | 98.5 | 91.2 | 79.1 | 159.2 | 173.7 | 186.9 | 209.9 |
| 1988 | 247.4 | 247.8 | 189.5 | 120.8 | 95.3 | 93.7 | 70.9 | 98.1 | 138.8 | 160.2 | 192.5 | 201.5 |
| 1989 | 224.2 | 183.9 | 168.2 | 106.8 | 84.5 | 79.0 | 62.5 | W | 86.8 | 122.8 | 125.7 | 160.7 |
| 1990 | 254.4 | W | 123.5 | 110.0 | 75.1 | W | W | W | 68.9 | W | 115.2 | 112.2 |
| 1991 | W | W | W | 97.3 | 70.8 | W | W | W | 115.0 | 103.3 | 108.0 | W |
| 1992 | W | W | W | W | W | W | W | W | W | W | 121.1 | W |
| 1993 | W | 183.4 | 178.9 | 112.5 | W | 67.4 | W | W | W | W | W | 151.0 |
| 1994 | 229.6 | 241.9 | 213.9 | 109.8 | 74.3 | 81.8 | 54.8 | 70.1 | W | 114.5 | 164.2 | 222.8 |
| 1995 | W | 252.7 | W | 101.3 | 78.4 | 76.7 | 56.8 | W | 106.2 | 148.2 | 217.0 | W |
| 1996 | 303.4 | 363.1 | 189.2 | 121.8 | 80.0 | W | 63.6 | 76.7 | 128.4 | 121.1 | 162.0 | 199.3 |
| 1997 | 221.0 | 193.0 | 146.3 | 110.3 | 92.8 | 84.2 | W | W | 113.1 | 130.8 | 197.7 | 314.7 |
| 1998 | 192.2 | 180.2 | 172.4 | 108.2 | 69.9 | W | W | W | 94.6 | W | 153.0 | W |
| 1999 | W | W | W | W | W | W | 62.0 | W | 110.6 | 158.8 | 161.3 | W |
| 2000 | W | 326.1 | W | 100.4 | W | W | W | 64.1 | 134.5 | 152.8 | W | 283.7 |
| 2001 | 297.0 | 181.8 | 198.9 | W | 71.8 | W | 60.7 | 62.6 | 100.6 | 141.1 | 137.5 | 158.8 |
| 2002 | 230.2 | 170.0 | 157.4 | W | W | 62.9 | 50.1 | W | W | 150.1 | 223.2 | 312.8 |
| 2003 | 340.8 | 334.4 | 258.9 | 110.6 | 111.0 | 134.8 | 116.9 | 113.5 | 180.4 | 211.4 | 179.9 | 280.9 |
| 2004 | 497.5 | 459.2 | 267.5 | 211.3 | 135.3 | 150.4 | 127.3 | 129.8 | 199.0 | 193.8 | 229.1 | 351.2 |
| 2005 | 491.0 | 510.7 | 407.0 | 225.9 | 198.3 | 186.1 | 139.4 | 173.5 | 215.7 | 198.8 | 281.9 | 504.5 |
| 2006 | 453.4 | 427.9 | 419.3 | 301.6 | 210.8 | 204.6 | 149.7 | 184.6 | 288.1 | 287.5 | 326.0 | 433.3 |
| 2007 | 495.3 | 724.0 | 499.8 | 371.6 | 259.9 | 232.4 | 214.0 | 210.5 | 230.0 | 238.6 | 328.4 | 485.2 |
| 2008 | 509.0 | 462.4 | 379.8 | 288.7 | 199.1 | 163.0 | 153.7 | 173.7 | 229.6 | 244.5 | 317.7 | 480.4 |
| 2009 | 517.6 | 518.2 | 351.1 | 247.6 | 152.3 | 175.9 | 155.7 | 140.6 | 196.9 | 254.0 | 274.7 | 427.7 |
| 2010 | 600.5 | 511.6 | 374.6 | 187.9 | 146.2 | 144.6 | 145.3 | 149.3 | 160.1 | 187.6 | 260.9 | 469.5 |
| 2011 | 536.4 | 474.0 | 353.1 | 191.0 | 129.7 | 119.0 | 126.3 | 129.9 | 182.9 | 213.1 | 247.6 | 312.8 |
| 2012 | 369.1 | 340.1 | 220.2 | 141.5 | 114.7 | 112.5 | 132.7 | 121.8 | 195.1 | 247.6 | 320.2 | 358.2 |
| 2013 | 401.9 | 453.6 | 408.5 | 223.2 | 131.9 | 115.8 | 118.7 | 133.0 | 182.1 | 197.5 | 253.8 | 428.2 |
| 2014 | 466.5 | 514.5 | 438.0 | 247.8 | 131.9 | 132.7 | 148.7 | 153.6 | 247.8 | 301.4 | 347.4 | 503.5 |
| 2015 | 578.6 | 723.9 | 522.1 | 228.8 | 169.6 | 172.1 | 175.9 | 174.0 | 226.9 | 272.0 | 283.8 | 302.6 |
| 2016 | 477.4 | 598.3 | 345.4 | 215.4 | 180.3 | 153.8 | 139.3 | 158.0 | 200.7 | 252.7 | 299.3 | 481.3 |
| 2017 | 533.7 | 496.7 | 360.7 | 219.9 | 202.0 | 201.9 | 189.2 | 202.5 | 218.9 | 252.3 | 323.6 | 491.5 |
| 2018 | 686.7 | 585.1 | 428.6 | 278.3 | 196.8 | 155.2 | 142.8 | 146.4 | 219.0 | 232.9 | 341.1 | 463.5 |
| 2019 | 502.5 | 512.7 | 352.3 | 249.3 | 156.3 | 178.1 | 168.7 | 181.8 | 245.5 | 277.6 | 369.1 | 508.0 |
| 2020 | 580.2 | 480.7 | 372.0 | 206.8 | 177.6 | 157.5 | 134.9 | 126.5 | 176.2 | 193.1 | 238.1 | 308.4 |
| 2021 | 444.5 | 491.2 | 340.2 | 241.6 | 150.5 | 161.7 | 109.5 | 126.7 | 170.9 | 170.4 | 246.9 | 317.4 |
| 2022 | 410.6 | 444.5 | 304.9 | |||||||||
| - = No Data Reported; -- = Not Applicable; NA = Not Available; W = Withheld to avoid disclosure of individual company data. |
| Release Date: 5/19/2022 |
| Next Release Date: TBD |