|
Download Data (XLS File) |
|
||||||||
|
||||||||
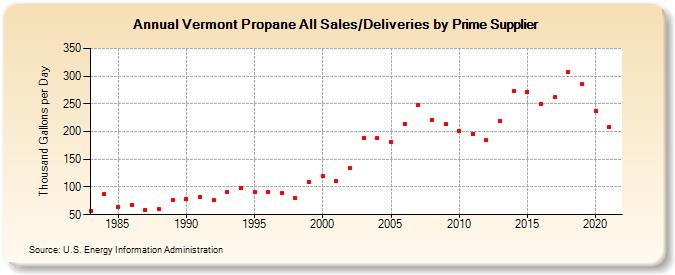
| Vermont Propane All Sales/Deliveries by Prime Supplier (Thousand Gallons per Day) | ||||||||
| Decade | Year-0 | Year-1 | Year-2 | Year-3 | Year-4 | Year-5 | Year-6 | Year-7 | Year-8 | Year-9 |
|---|---|---|---|---|---|---|---|---|---|---|
| 1980's | 56.3 | 87.8 | 64.7 | 66.8 | 58.2 | 60.3 | 77.1 | |||
| 1990's | 78.6 | 82.2 | 75.9 | 90.9 | 97.8 | 90.1 | 91.5 | 88.6 | 79.9 | 109.0 |
| 2000's | 119.3 | 111.0 | 135.0 | 189.0 | 188.2 | 181.8 | 213.4 | 247.4 | 220.9 | 213.4 |
| 2010's | 201.2 | 196.2 | 184.2 | 218.7 | 273.5 | 271.4 | 250.0 | 261.6 | 308.1 | 285.7 |
| 2020's | 237.2 |
| - = No Data Reported; -- = Not Applicable; NA = Not Available; W = Withheld to avoid disclosure of individual company data. |
| Release Date: 6/1/2022 |
| Next Release Date: TBD |