|
Download Data (XLS File) |
|
||||||||
|
||||||||
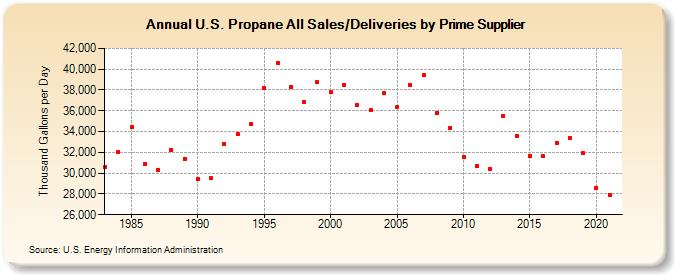
| U.S. Propane All Sales/Deliveries by Prime Supplier (Thousand Gallons per Day) | ||||||||
| Decade | Year-0 | Year-1 | Year-2 | Year-3 | Year-4 | Year-5 | Year-6 | Year-7 | Year-8 | Year-9 |
|---|---|---|---|---|---|---|---|---|---|---|
| 1980's | 30,607.8 | 32,079.8 | 34,390.0 | 30,836.1 | 30,333.8 | 32,222.6 | 31,371.9 | |||
| 1990's | 29,416.8 | 29,492.2 | 32,817.4 | 33,745.3 | 34,751.1 | 38,230.2 | 40,621.7 | 38,268.3 | 36,828.3 | 38,719.1 |
| 2000's | 37,778.0 | 38,521.2 | 36,554.0 | 36,050.5 | 37,691.5 | 36,382.4 | 38,466.5 | 39,410.4 | 35,811.7 | 34,376.6 |
| 2010's | 31,600.0 | 30,709.8 | 30,426.7 | 35,539.9 | 33,524.8 | 31,655.6 | 31,616.1 | 32,928.5 | 33,411.0 | 31,910.9 |
| 2020's | 28,605.6 |
| - = No Data Reported; -- = Not Applicable; NA = Not Available; W = Withheld to avoid disclosure of individual company data. |
| Release Date: 6/1/2022 |
| Next Release Date: TBD |