|
Download Data (XLS File) |
|
||||||||
|
||||||||
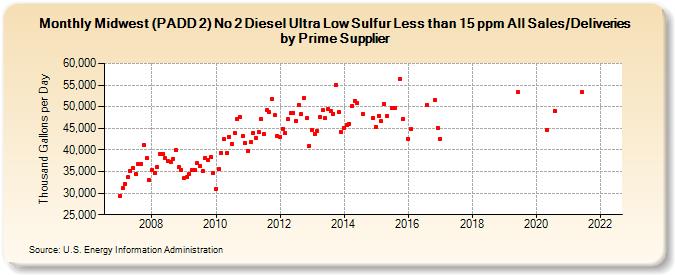
| Midwest (PADD 2) No 2 Diesel Ultra Low Sulfur Less than 15 ppm All Sales/Deliveries by Prime Supplier (Thousand Gallons per Day) | ||||||||
| Year | Jan | Feb | Mar | Apr | May | Jun | Jul | Aug | Sep | Oct | Nov | Dec |
|---|---|---|---|---|---|---|---|---|---|---|---|---|
| 2007 | 29,279.4 | 31,213.8 | 32,185.2 | 33,616.5 | 35,167.8 | 35,806.4 | 34,349.8 | 36,691.7 | 36,830.3 | 41,244.0 | 38,036.3 | 33,013.9 |
| 2008 | 35,332.4 | 34,641.5 | 35,963.6 | 39,149.7 | 39,022.1 | 38,012.8 | 37,343.7 | 37,220.5 | 38,006.7 | 39,884.6 | 35,950.2 | 35,361.8 |
| 2009 | 33,471.9 | 33,667.9 | 34,481.0 | 35,402.6 | 35,266.5 | 36,898.3 | 36,266.8 | 35,104.7 | 38,163.7 | 37,674.5 | 38,384.9 | 34,621.2 |
| 2010 | 31,052.5 | 35,465.8 | 39,306.7 | 42,520.6 | 39,265.6 | 43,020.4 | 41,373.8 | 43,878.8 | 47,054.6 | 47,623.0 | 43,185.4 | 41,624.4 |
| 2011 | 39,647.8 | 41,807.3 | 43,853.9 | 42,798.5 | 44,206.2 | 47,123.4 | 43,663.0 | 49,123.9 | 48,656.8 | 51,748.5 | 47,975.9 | 43,315.6 |
| 2012 | 43,079.2 | 44,902.6 | 43,881.7 | 47,118.4 | 48,474.8 | 48,491.5 | 46,696.5 | 50,506.5 | 48,262.4 | 52,078.7 | 47,273.6 | 40,997.4 |
| 2013 | 44,702.3 | 43,761.0 | 44,280.0 | 47,702.2 | 49,174.1 | 47,328.9 | 49,365.6 | 48,908.8 | 48,372.3 | 55,078.9 | 48,776.2 | 44,038.4 |
| 2014 | 45,128.6 | 45,797.6 | 46,057.1 | 50,200.8 | 51,426.3 | 50,842.2 | W | 48,343.4 | W | W | W | 47,469.8 |
| 2015 | 45,361.5 | 47,957.2 | 46,611.0 | 50,656.2 | 47,942.2 | W | 49,802.6 | 49,801.0 | W | 56,433.3 | 47,116.2 | W |
| 2016 | 42,615.4 | 44,810.2 | W | W | W | W | W | 50,345.2 | W | W | 51,568.1 | 45,174.2 |
| 2017 | 42,523.1 | W | W | W | W | W | W | W | W | W | W | W |
| 2018 | W | W | W | W | W | W | W | W | W | W | W | W |
| 2019 | W | W | W | W | W | 53,318.5 | W | W | W | W | W | W |
| 2020 | W | W | W | W | 44,602.9 | W | W | 49,010.1 | W | W | W | W |
| 2021 | W | W | W | W | W | 53,348.1 | W | W | W | W | W | W |
| 2022 | W | W | W | |||||||||
| - = No Data Reported; -- = Not Applicable; NA = Not Available; W = Withheld to avoid disclosure of individual company data. |
| Release Date: 5/19/2022 |
| Next Release Date: TBD |