|
Download Data (XLS File) |
|
||||||||
|
||||||||
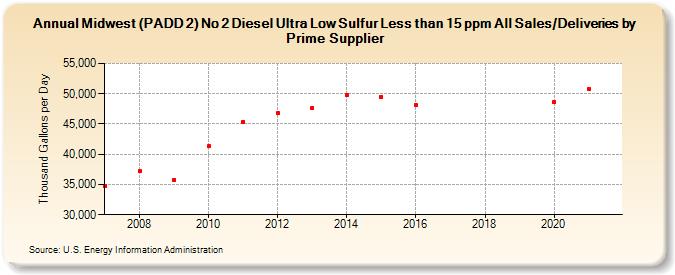
| Midwest (PADD 2) No 2 Diesel Ultra Low Sulfur Less than 15 ppm All Sales/Deliveries by Prime Supplier (Thousand Gallons per Day) | ||||||||
| Decade | Year-0 | Year-1 | Year-2 | Year-3 | Year-4 | Year-5 | Year-6 | Year-7 | Year-8 | Year-9 |
|---|---|---|---|---|---|---|---|---|---|---|
| 2000's | 34,801.5 | 37,164.4 | 35,785.4 | |||||||
| 2010's | 41,299.6 | 45,341.3 | 46,813.4 | 47,651.2 | 49,763.2 | 49,441.7 | 48,160.5 | W | W | W |
| 2020's | 48,580.8 |
| - = No Data Reported; -- = Not Applicable; NA = Not Available; W = Withheld to avoid disclosure of individual company data. |
| Release Date: 6/1/2022 |
| Next Release Date: TBD |